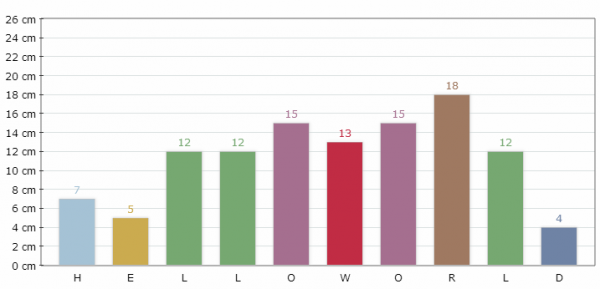
Summary of points to note about chart components
Introduction ichartjs is a graphics library based on HTML5. Use pure JavaScript language and use HTML5 canvas tag to draw various graphics. ichartjs is committed to providing simple, intuitive, and interactive experience-level chart components for your applications. It is a solution for WEB/APP chart display. If you are developing HTML5 applications, ichartjs is just for you. ichartjs currently supports pie charts, donut charts, line charts, area charts, column charts, and bar charts. ichartjs is an open source project based on the Apache License 2.0 agreement. No1. One-minute quick start tutorial-Hello World A journey of a thousand miles begins with a single step. Let's start with Hello World. First introduce the js filecode snippet//
1. iChart-component custom graphics library chart/report development tutorial

##Introduction: ichartjs is an HTML5-based Graphics library. Use pure JavaScript language and use HTML5 canvas tag to draw various graphics. ichartjs is committed to providing simple, intuitive, and interactive experience-level chart components for your applications. It is a solution for WEB/APP chart display. If you are developing HTML5 applications, ichartjs is just for you. ichartjs currently supports pie charts, donut charts, line charts, area charts, column charts, and bar charts. ichartjs is an open source project based on the Apache License 2.0 agreement.
2. Sample code of pure JavaScript chart component dhtmlxChart

Introduction: dhtmlxChart is also a JavaScript-based chart application component. Similar to the xCharts shared before, dhtmlxChart also provides a very rich chart type. It should be said that compared with xCharts, it provides more chart types. Includes pie charts, radar charts, discrete point plots, and more complex chart types. dhtmlxChart provides an open source version, but its commercial version costs more than $49, which is a bit expensive. For the configuration of dhtmlxChart, just quote the relevant js scripts and css files of dhtmlx on the page to complete the installation:
A brief analysis of jquery's js chart component highcharts_jquery
Introduction: This article mainly introduces jquery’s js chart component highcharts in detail. Friends who need it can come and refer to it. I hope it will be helpful to everyone4.
Bootstrap Chart component usage tutorial_javascript skills

[Related Q&A recommendations]:
javascript - How does Echarts layout chart components? javascript - echarts3 Where is the module for loading svg type files?
The above is the detailed content of Summary of points to note about chart components. For more information, please follow other related articles on the PHP Chinese website!

Hot AI Tools

Undresser.AI Undress
AI-powered app for creating realistic nude photos

AI Clothes Remover
Online AI tool for removing clothes from photos.

Undress AI Tool
Undress images for free

Clothoff.io
AI clothes remover

Video Face Swap
Swap faces in any video effortlessly with our completely free AI face swap tool!

Hot Article

Hot Tools

Notepad++7.3.1
Easy-to-use and free code editor

SublimeText3 Chinese version
Chinese version, very easy to use

Zend Studio 13.0.1
Powerful PHP integrated development environment

Dreamweaver CS6
Visual web development tools

SublimeText3 Mac version
God-level code editing software (SublimeText3)

Hot Topics
 1655
1655
 14
14
 1414
1414
 52
52
 1307
1307
 25
25
 1253
1253
 29
29
 1227
1227
 24
24
 Is the company's security software causing the application to fail to run? How to troubleshoot and solve it?
Apr 19, 2025 pm 04:51 PM
Troubleshooting and solutions to the company's security software that causes some applications to not function properly. Many companies will deploy security software in order to ensure internal network security. ...
 How do I convert names to numbers to implement sorting and maintain consistency in groups?
Apr 19, 2025 pm 11:30 PM
Solutions to convert names to numbers to implement sorting In many application scenarios, users may need to sort in groups, especially in one...
 How does IntelliJ IDEA identify the port number of a Spring Boot project without outputting a log?
Apr 19, 2025 pm 11:45 PM
Start Spring using IntelliJIDEAUltimate version...
 How to elegantly obtain entity class variable names to build database query conditions?
Apr 19, 2025 pm 11:42 PM
When using MyBatis-Plus or other ORM frameworks for database operations, it is often necessary to construct query conditions based on the attribute name of the entity class. If you manually every time...
 How to simplify field mapping issues in system docking using MapStruct?
Apr 19, 2025 pm 06:21 PM
Field mapping processing in system docking often encounters a difficult problem when performing system docking: how to effectively map the interface fields of system A...
 How to safely convert Java objects to arrays?
Apr 19, 2025 pm 11:33 PM
Conversion of Java Objects and Arrays: In-depth discussion of the risks and correct methods of cast type conversion Many Java beginners will encounter the conversion of an object into an array...
 E-commerce platform SKU and SPU database design: How to take into account both user-defined attributes and attributeless products?
Apr 19, 2025 pm 11:27 PM
Detailed explanation of the design of SKU and SPU tables on e-commerce platforms This article will discuss the database design issues of SKU and SPU in e-commerce platforms, especially how to deal with user-defined sales...
 How to use the Redis cache solution to efficiently realize the requirements of product ranking list?
Apr 19, 2025 pm 11:36 PM
How does the Redis caching solution realize the requirements of product ranking list? During the development process, we often need to deal with the requirements of rankings, such as displaying a...


