5 essential debugging skills for JS debugging_javascript skills
1. debugger;
I have said before that you can add a debugger; to the JavaScript code to manually create a breakpoint effect.
Need conditional breakpoints? You just need to surround it with if statements:
debugger;
}
But remember to delete them before publishing the program.
Sometimes you will find that the DOM is not under your control and will undergo some strange changes, making it difficult for you to find the source of the problem.
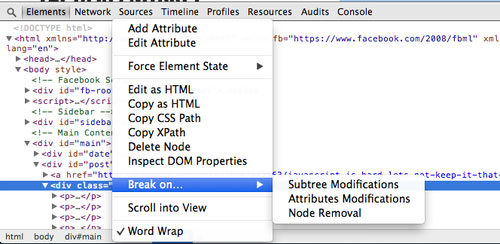
There is a super useful function in the development tools of Google Chrome, which is specially designed to deal with this situation. It is called “Break on…”. You can see this by right-clicking on the DOM node. menu item.
The triggering condition of the breakpoint can be set when the node is deleted, there is any change in the node's attributes, or there is a change in one of its child nodes.
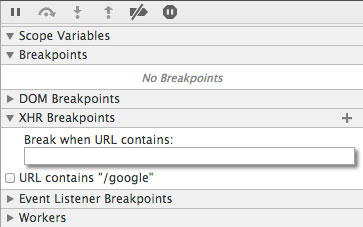
3. Ajax breakpointXHR breakpoints, or Ajax breakpoints, as their name suggests, allow us to set a breakpoint that triggers specific Ajax calls when they occur.
This trick is very effective when you are debugging network transmission of web applications.
4. Mobile device simulation environmentThere are some very interesting tools in Google Chrome that simulate mobile devices to help us debug the running of programs on mobile devices.
The way to find it is: press F12 to bring up the developer tools, then press the ESC key (the current tab cannot be Console), you will see the second layer of debugging window appear, inside the Emulation tab page A variety of analog devices are available.
Of course, this does not turn into a real iPhone, it just simulates the iPhone's size, touch events and browser User Agent values.
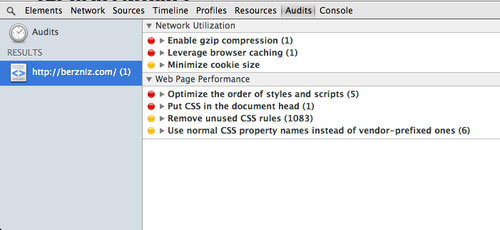
5. Use Audits to improve your websiteYSlow is a great tool. Google Chrome’s developer tools also have a very similar tool called Audits.
It can quickly audit your website and give you very practical and effective suggestions and methods for optimizing your website.
Are there any others?I don’t know how I would develop without these tools. I’ll be writing more tips on this as well – stay tuned for my latest post once I find out.

Hot AI Tools

Undresser.AI Undress
AI-powered app for creating realistic nude photos

AI Clothes Remover
Online AI tool for removing clothes from photos.

Undress AI Tool
Undress images for free

Clothoff.io
AI clothes remover

Video Face Swap
Swap faces in any video effortlessly with our completely free AI face swap tool!

Hot Article

Hot Tools

Notepad++7.3.1
Easy-to-use and free code editor

SublimeText3 Chinese version
Chinese version, very easy to use

Zend Studio 13.0.1
Powerful PHP integrated development environment

Dreamweaver CS6
Visual web development tools

SublimeText3 Mac version
God-level code editing software (SublimeText3)

Hot Topics
 1663
1663
 14
14
 1420
1420
 52
52
 1313
1313
 25
25
 1266
1266
 29
29
 1239
1239
 24
24
 Demystifying JavaScript: What It Does and Why It Matters
Apr 09, 2025 am 12:07 AM
JavaScript is the cornerstone of modern web development, and its main functions include event-driven programming, dynamic content generation and asynchronous programming. 1) Event-driven programming allows web pages to change dynamically according to user operations. 2) Dynamic content generation allows page content to be adjusted according to conditions. 3) Asynchronous programming ensures that the user interface is not blocked. JavaScript is widely used in web interaction, single-page application and server-side development, greatly improving the flexibility of user experience and cross-platform development.
 The Evolution of JavaScript: Current Trends and Future Prospects
Apr 10, 2025 am 09:33 AM
The latest trends in JavaScript include the rise of TypeScript, the popularity of modern frameworks and libraries, and the application of WebAssembly. Future prospects cover more powerful type systems, the development of server-side JavaScript, the expansion of artificial intelligence and machine learning, and the potential of IoT and edge computing.
 JavaScript Engines: Comparing Implementations
Apr 13, 2025 am 12:05 AM
Different JavaScript engines have different effects when parsing and executing JavaScript code, because the implementation principles and optimization strategies of each engine differ. 1. Lexical analysis: convert source code into lexical unit. 2. Grammar analysis: Generate an abstract syntax tree. 3. Optimization and compilation: Generate machine code through the JIT compiler. 4. Execute: Run the machine code. V8 engine optimizes through instant compilation and hidden class, SpiderMonkey uses a type inference system, resulting in different performance performance on the same code.
 JavaScript: Exploring the Versatility of a Web Language
Apr 11, 2025 am 12:01 AM
JavaScript is the core language of modern web development and is widely used for its diversity and flexibility. 1) Front-end development: build dynamic web pages and single-page applications through DOM operations and modern frameworks (such as React, Vue.js, Angular). 2) Server-side development: Node.js uses a non-blocking I/O model to handle high concurrency and real-time applications. 3) Mobile and desktop application development: cross-platform development is realized through ReactNative and Electron to improve development efficiency.
 Python vs. JavaScript: The Learning Curve and Ease of Use
Apr 16, 2025 am 12:12 AM
Python is more suitable for beginners, with a smooth learning curve and concise syntax; JavaScript is suitable for front-end development, with a steep learning curve and flexible syntax. 1. Python syntax is intuitive and suitable for data science and back-end development. 2. JavaScript is flexible and widely used in front-end and server-side programming.
 How to Build a Multi-Tenant SaaS Application with Next.js (Frontend Integration)
Apr 11, 2025 am 08:22 AM
This article demonstrates frontend integration with a backend secured by Permit, building a functional EdTech SaaS application using Next.js. The frontend fetches user permissions to control UI visibility and ensures API requests adhere to role-base
 From C/C to JavaScript: How It All Works
Apr 14, 2025 am 12:05 AM
The shift from C/C to JavaScript requires adapting to dynamic typing, garbage collection and asynchronous programming. 1) C/C is a statically typed language that requires manual memory management, while JavaScript is dynamically typed and garbage collection is automatically processed. 2) C/C needs to be compiled into machine code, while JavaScript is an interpreted language. 3) JavaScript introduces concepts such as closures, prototype chains and Promise, which enhances flexibility and asynchronous programming capabilities.
 Building a Multi-Tenant SaaS Application with Next.js (Backend Integration)
Apr 11, 2025 am 08:23 AM
I built a functional multi-tenant SaaS application (an EdTech app) with your everyday tech tool and you can do the same. First, what’s a multi-tenant SaaS application? Multi-tenant SaaS applications let you serve multiple customers from a sing


