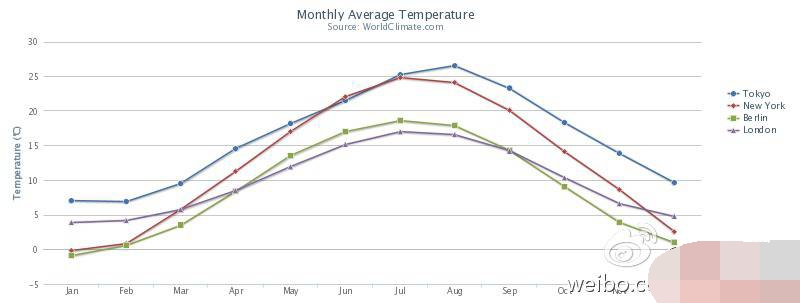
What are Highcharts?
Highcharts is a chart library written in pure JavaScript, which can easily and conveniently add interactive charts to web sites or web applications, and is free for personal study, personal websites and non-commercial use. The chart types currently supported by HighCharts include curve charts, area charts, bar charts, pie charts, scatter charts and comprehensive charts.

HighCharts has a beautiful interface. Since it is written in JavaScript, it does not require plug-ins to run like Flash and Java, and it runs quickly. In addition, HighCharts has very good compatibility and can perfectly support most current browsers. The latest official version now is HighCharts2.3.5.
Features
Good Compatibility: It works well in all modern browsers, including iPhone, iPad and even Internet Explorer 6. Standard browsers use SVG for graphics drawing, while traditional Internet Explorer uses VML for drawing.
Completely free for non-commercial users: Whether you want to use Highcharts on your personal website, school website or any non-profit organization, you do not need authorization.
Open source: Whether you are using the free version or the commercial licensed version of Highcharts, you can download its source code and make your own modifications, which gives users great freedom.
Pure JavaScript: Highcharts is completely based on native browser technology and does not need to rely on client-side plug-ins like Flash or Java. Additionally, you don't need to install anything on the server, including PHP or ASP.NET. Highcharts only requires two core files: the highcharts.js core file and one of the jQuery, MooTools or Prototype frameworks, which may already be used in your web pages.
Numerous chart types: Highcharts supports common chart types such as line charts, curve charts, area charts, area curve charts, bar charts, pie charts, scatter charts, etc., and can combine them in one chart.
Simple configuration syntax: Configuring Highcharts does not require any programming skills, its configuration variables only require a simple JavaScript object.
Dynamic: At any time after creating the chart, you can add, delete and modify series and data points, as well as modify the axes, through a complete API. Many events provide hooks for programming charts, combined with the AJAX API of jQuery, MooTools or the Prototype framework, it even provides solutions that can dynamically display server data in real time.
Multiple axes: Sometimes you need to compare data of different measures, such as temperature, rainfall and air pressure. Highcharts allows you to set a different Y-axis for each data set, and if you want to compare data of different categories, It is also possible to set a different X-axis. Each axis can be placed anywhere above, below, left or right on the chart, and all options can be set individually, including flip, style and position.
Tips label: When the mouse stops at any point or series on the chart, a toolbar tip containing relevant information can be displayed, and when the mouse moves on the chart, it will automatically select the point closest to the mouse for processing. Display, which provides great convenience for viewing chart data.
Timeline: 75% of charts have a timeline as the
Export and Print: If the export module is enabled, your users can export the chart to PNG, JPG, PDF or SVG format by clicking the export button, or print it directly.
Zoom: You can zoom to take a closer look at the part of the chart you are interested in. Zoom can be applied to the X-axis, Y-axis, or both axes at the same time.
External data loading: Highcharts data comes from a JavaScript array, so the data can be defined in a local configuration object, or in a separate file, or even from different websites. Additionally, data can be passed to Highcharts in any form, with just a callback function that parses the data into an array.
Angle Meter: For dashboards and angle meters, Highcharts provides a speedometer-like chart that allows you to view data at a glance.
Polar Charts: Cartesian charts can be converted to polar or radial charts with an easy option.
Invert or flip the chart: Sometimes you need to flip the chart so that the X-axis is vertical, this is also supported.
Rotate labels: All text labels, including axis labels, data point labels and axis title labels, can be rotated at any angle.
Calling method
var chart = new Highcharts.Chart({
using using using use using ‐ off off ‐ off ‐ ‐ ‐ ‐ chart: {…}
global: { …}
Labels: {…}
lang: {…}
legend: {…}
loading: {…}
navigation: {…}
pane: {…}
plotOptions: {…}
series: [{…}]
subtitle: {…}
title: {…}
tooltip: {…}
xAxis: {…}
yAxis: {…}
});


