Example of how Chrome debugs JavaScript
In website and front-end development, JavaScript is a powerful scripting language, but many people love and hate it, and sometimes directly ignore its importance. Of course, there are many ways to debug js. Firebug under ff and ie also have very powerful debugging tools. Here I will show you how to debug js in chrome.
1. Open the demo with chrome browser
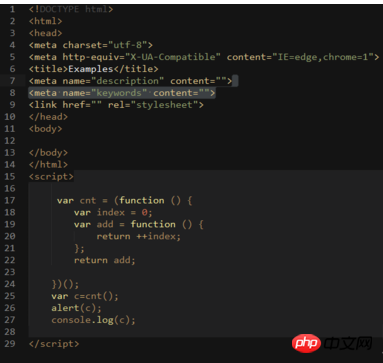
2. Press the f12 key
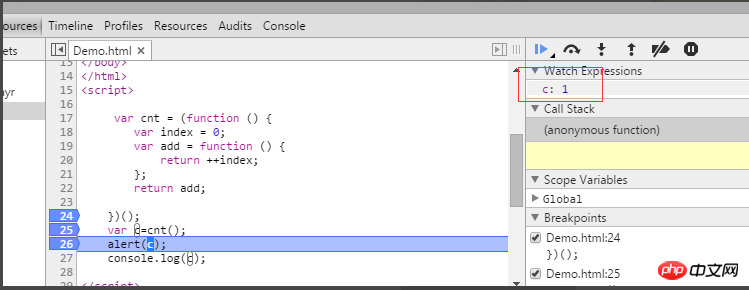
##3. Add breakpoint

4. Monitor variables

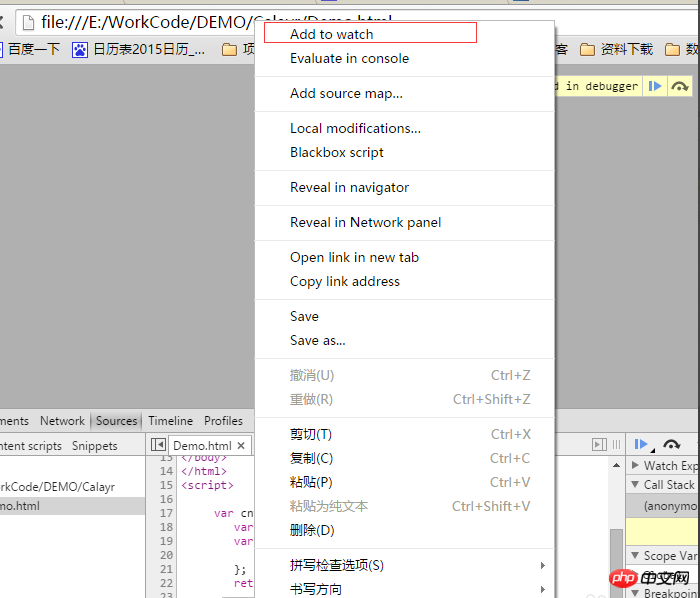
5. Check the console input log

6.demo code:
<!DOCTYPE html>
<html>
<head>
<meta charset="utf-8">
<meta http-equiv="X-UA-Compatible" content="IE=edge,chrome=1">
<title>Examples</title>
<meta name="description" content="">
<meta name="keywords" content="">
<link href="" rel="stylesheet">
</head>
<body>

</body>
</html>
<script>

     var cnt = (function () {
        var index = 0;
        var add = function () {
            return ++index;
        };
        return add;

    })();
    var c=cnt();
    alert(c);
    console.log(c);

</script>The above is the detailed content of Example of how Chrome debugs JavaScript. For more information, please follow other related articles on the PHP Chinese website!

Hot AI Tools

Undresser.AI Undress
AI-powered app for creating realistic nude photos

AI Clothes Remover
Online AI tool for removing clothes from photos.

Undress AI Tool
Undress images for free

Clothoff.io
AI clothes remover

Video Face Swap
Swap faces in any video effortlessly with our completely free AI face swap tool!

Hot Article

Hot Tools

Notepad++7.3.1
Easy-to-use and free code editor

SublimeText3 Chinese version
Chinese version, very easy to use

Zend Studio 13.0.1
Powerful PHP integrated development environment

Dreamweaver CS6
Visual web development tools

SublimeText3 Mac version
God-level code editing software (SublimeText3)

Hot Topics
 1672
1672
 14
14
 1428
1428
 52
52
 1332
1332
 25
25
 1276
1276
 29
29
 1256
1256
 24
24
 What is Updater.exe in Windows 11/10? Is this the Chrome process?
Mar 21, 2024 pm 05:36 PM
Every application you run on Windows has a component program to update it. So if you are using Google Chrome or Google Earth, it will run a GoogleUpdate.exe application, check if an update is available, and then update it based on the settings. However, if you no longer see it and instead see a process updater.exe in the Task Manager of Windows 11/10, there is a reason for this. What is Updater.exe in Windows 11/10? Google has rolled out updates for all its apps like Google Earth, Google Drive, Chrome, etc. This update brings
 Recommended: Excellent JS open source face detection and recognition project
Apr 03, 2024 am 11:55 AM
Face detection and recognition technology is already a relatively mature and widely used technology. Currently, the most widely used Internet application language is JS. Implementing face detection and recognition on the Web front-end has advantages and disadvantages compared to back-end face recognition. Advantages include reducing network interaction and real-time recognition, which greatly shortens user waiting time and improves user experience; disadvantages include: being limited by model size, the accuracy is also limited. How to use js to implement face detection on the web? In order to implement face recognition on the Web, you need to be familiar with related programming languages and technologies, such as JavaScript, HTML, CSS, WebRTC, etc. At the same time, you also need to master relevant computer vision and artificial intelligence technologies. It is worth noting that due to the design of the Web side
 Essential tools for stock analysis: Learn the steps to draw candle charts with PHP and JS
Dec 17, 2023 pm 06:55 PM
Essential tools for stock analysis: Learn the steps to draw candle charts in PHP and JS. Specific code examples are required. With the rapid development of the Internet and technology, stock trading has become one of the important ways for many investors. Stock analysis is an important part of investor decision-making, and candle charts are widely used in technical analysis. Learning how to draw candle charts using PHP and JS will provide investors with more intuitive information to help them make better decisions. A candlestick chart is a technical chart that displays stock prices in the form of candlesticks. It shows the stock price
 What is the Chrome plug-in extension installation directory?
Mar 08, 2024 am 08:55 AM
What is the Chrome plug-in extension installation directory? Under normal circumstances, the default installation directory of Chrome plug-in extensions is as follows: 1. The default installation directory location of chrome plug-ins in windowsxp: C:\DocumentsandSettings\username\LocalSettings\ApplicationData\Google\Chrome\UserData\Default\Extensions2. chrome in windows7 The default installation directory location of the plug-in: C:\Users\username\AppData\Local\Google\Chrome\User
 How to solve the problem that Google Chrome cannot open web pages
Jan 04, 2024 pm 10:18 PM
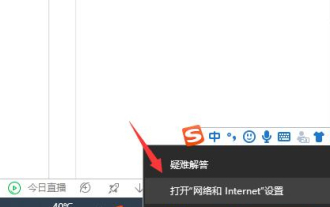
What should I do if the Google Chrome web page cannot be opened? Many friends like to use Google Chrome. Of course, some friends find that they cannot open web pages normally or the web pages open very slowly during use. So what should you do if you encounter this situation? Let’s take a look at the solution to the problem that Google Chrome web pages cannot be opened with the editor. Solution to the problem that the Google Chrome webpage cannot be opened. Method 1. In order to help players who have not passed the level yet, let us learn about the specific methods of solving the puzzle. First, right-click the network icon in the lower right corner and select "Network and Internet Settings." 2. Click "Ethernet" and then click "Change Adapter Options". 3. Click the "Properties" button. 4. Double-click to open i
 How to search for text across all tabs in Chrome and Edge
Feb 19, 2024 am 11:30 AM
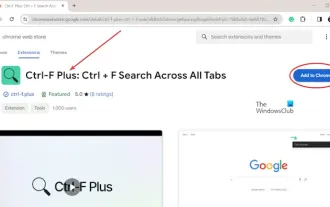
This tutorial shows you how to find specific text or phrases on all open tabs in Chrome or Edge on Windows. Is there a way to do a text search on all open tabs in Chrome? Yes, you can use a free external web extension in Chrome to perform text searches on all open tabs without having to switch tabs manually. Some extensions like TabSearch and Ctrl-FPlus can help you achieve this easily. How to search text across all tabs in Google Chrome? Ctrl-FPlus is a free extension that makes it easy for users to search for a specific word, phrase or text across all tabs of their browser window. This expansion
 PHP and JS Development Tips: Master the Method of Drawing Stock Candle Charts
Dec 18, 2023 pm 03:39 PM
With the rapid development of Internet finance, stock investment has become the choice of more and more people. In stock trading, candle charts are a commonly used technical analysis method. It can show the changing trend of stock prices and help investors make more accurate decisions. This article will introduce the development skills of PHP and JS, lead readers to understand how to draw stock candle charts, and provide specific code examples. 1. Understanding Stock Candle Charts Before introducing how to draw stock candle charts, we first need to understand what a candle chart is. Candlestick charts were developed by the Japanese
 How to open the chrome dinosaur game? Quickly enter the Little Dinosaur game tutorial
Mar 13, 2024 pm 06:49 PM
The Chrome browser has launched an exclusive Easter egg game, Little Dinosaur, which supports offline game play. If your computer is disconnected from the Internet, you can play the Dinosaur game to pass the time. How to open the Dinosaur game on Chrome? Let me teach you below. How to play Google Dinosaur? 1. First, unplug the network cable or disable Ethernet in the network connection. 2. Double-click to open Google Chrome when the Internet is disconnected, enter a random URL in the address bar, and press Return. 3. Then a small dinosaur will appear above the "Not connected to the Internet" prompt. 4. We can control the little dinosaur to play the game by pressing the space bar.


