This time I will bring you the step analysis of the js code compiled by vscode debugging, and the js code compiled by vscode debugging What are the precautions?The following is a practical case, let's take a look.
Preface
In the development process, it is almost impossible to write a flawless program at once and debug the code with breakpoints is a common need.
vscode is a great editor with built-in powerful debugging capabilities. After simple settings, you can debug js files. But sometimes the content we want to debug is compiled, and of course we can debug the compiled code directly. However, the readability of the code after compilation and compression is very poor, and it may not be possible to view it in modules. Is there any way to debug the code before compilation? The answer is of course yes.
Not much to say below, let’s take a look at the detailed introduction.
General debugging of vscode
The debugging interface of vscode is on the far left side of the window:

In the latest version of vscode, this option is hidden by default and needs to be opened by yourself.
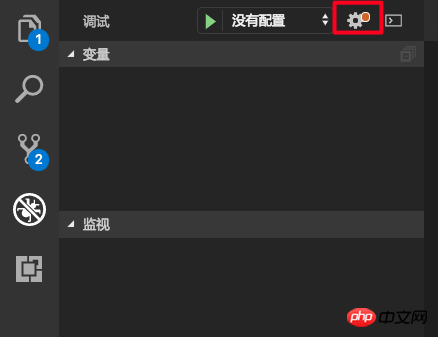
When the debugging interface is opened for the first time, there is currently no debugging configuration. We can click the gear icon to add one:

After selecting nodejs, it will automatically be added to the current project Add the .vscode/launch.json file to the directory. This file is the vscode debugging configuration file.
The content of a simple configuration file is:
{
 // 使用 IntelliSense 了解相关属性。
 // 悬停以查看现有属性的描述。
 // 欲了解更多信息,请访问: https://go.microsoft.com/fwlink/?linkid=830387
 "version": "0.2.0",
 "configurations": [
 {
 "type": "node",
 "request": "launch",
 "name": "启动程序",
 "program": "${workspaceFolder}/index.js"
 }
 ]
}What the above configuration does is to start the index.js file in the current directory for debugging.
We can also set up to automatically debug the currently opened file every time we press F5. We only need to modify the program:
{
 "program": "${file}"
}Debug the compiled file
If you want to debug the compiled file, you need to set the launch.json file.
vscode To debug the compiled code, he needs to know which codes have been compiled, and he needs to know the correspondence between the compiled code and the pre-compiled code.
In fact, theoretically vscode can consider each file to be executed as a compiled file and search for source files? I guess for performance reasons we need to specify which files are compiled ourselves. In launch.json, use the outFiles attribute to specify the compiled output file:
{
 "version": "0.2.0",
 "configurations": [
 {
 // 省略其他设置...
 "outFiles": [
 "${workspaceFolder}/lib/*.js",
 ]
 // ...
 }
 ]
}Although it is a bit troublesome, fortunately we can use the wildcard character .
Now that we have the compiled files, vscode also needs to know the source files and the corresponding relationship between the compiled files and the source files. Does this sound familiar? This process is implemented through sourcemap.
We need to generate the corresponding .map file when compiling the js file, and append the address of the .map file after the output js file:
//@ sourceMappingURL=./index.js.map
ok, now vscode is executing the js file , it will check whether it is compiled code from outFile. If so, it will be mapped to the source code through sourcemap to facilitate our debugging.
Automatically execute compilation
Now our development process becomes: modify source code -> compile source code -> debug.
For convenience, we can set the preLaunchTask attribute. The function of this attribute is to execute a prelaunch task before each debugging. We can put the compilation process in the prelaunch task.
First we need to configure a task. The task configuration file is in .vscode/tasks.json. You can open the command palette (⇧⌘P (Windows, Linux Ctrl Shift P)) and select "Task: Configure Task" Automatically generate one:
{
 // See https://go.microsoft.com/fwlink/?LinkId=733558
 // for the documentation about the tasks.json format
 "version": "2.0.0",
 "tasks": [
 {
 "label": "build",
 "type": "npm",
 "script": "build",
 "problemMatcher": []
 }
 ]
}Here we configure npm run build as a pre-task, and build will be performed first every time debugging is performed.
Sample configuration file
{
 // 使用 IntelliSense 了解相关属性。
 // 悬停以查看现有属性的描述。
 // 欲了解更多信息,请访问: https://go.microsoft.com/fwlink/?linkid=830387
 "version": "0.2.0",
 "configurations": [
 {
 "type": "node",
 "request": "launch",
 "name": "example",
 "program": "${workspaceFolder}/index.js",
 "preLaunchTask": "build",
 "cwd": "${workspaceFolder}",
 "outFiles": [
 "${workspaceFolder}/lib/*.js"
 ]
}I believe you have mastered the method after reading the case in this article. For more exciting information, please pay attention to other related articles on the PHP Chinese website!
Recommended reading:
Detailed explanation of the steps to introduce js numeric keypad in vue
Detailed explanation of how to use the jQuery class name selector (.class)
The above is the detailed content of vscode debugging compiled js code step analysis. For more information, please follow other related articles on the PHP Chinese website!


