D3 is a data-driven document. This article mainly introduces the method of drawing dynamic progress bars based on D3.js. Friends in need can refer to
What is D3
The full name of D3 is (Data-Driven Documents). As the name suggests, you can know that it is a document driven by data. The name sounds a bit abstract, but to put it simply, it is actually a JavaScript function library. It is mainly used for data visualization. If you don’t know what JavaScript is, please learn JavaScript first and recommend teacher Ruan Yifeng’s tutorial.
The suffix of JavaScript files is usually .js, so D3 is often called D3.js. D3 provides a variety of simple and easy-to-use functions, which greatly simplifies the difficulty of operating data in JavaScript. Since it is essentially JavaScript, all functions can be implemented using JavaScript, but it can greatly reduce your workload, especially in data visualization. D3 has reduced the complex steps of generating visualizations to a few simple functions. , you only need to enter a few simple data to convert it into a variety of gorgeous graphics. Friends who have basic knowledge of JavaScript will easily understand it.
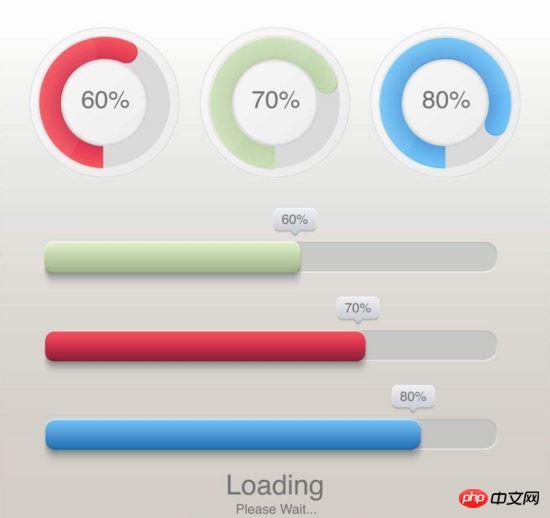
When website pages are loaded and forms are submitted, progress bars are often used to express the loading process to optimize user experience. Common progress bars include rectangular progress bars and circular progress bars, as shown in the following figure:

We often use svg or canvas to draw dynamic graphics, but the drawing process is relatively cumbersome. For intuitive and beautiful progress bars, the community also provides mature solutions such as highcharts/ECharts, etc., but the configuration-based development method cannot achieve 100% customized drawing. This article will take you step by step to implement a dynamic progress bar from scratch using D3.js, and share the code logic principles.
Basic requirements
Understand how svg draws basic graphics
Understand the D3.js v4 version
Understand how to use D3.js (v4) to draw the basic graphics of svg
Draw a circular progress bar
For a circular progress bar, we first split the tasks:
Draw an embedded Set arc
Real-time data display at the center of the circle
Display animation
Beautification
1. Draw nested arcs
For circles, svg provides ready-made circle tags for use, but its disadvantage is that for circles The progress bar can be satisfied by using circle, but when the graphics is further expanded, such as drawing a semicircle, the processing of circle becomes tricky. D3.js provides arc related API to encapsulate the circle drawing method:
var arc = d3.arc()
   .innerRadius(180)
   .outerRadius(240)
   //.startAngle(0)
   //.endAngle(Math.PI)
arc(); // "M0,-100A100,100,0,0,1,100,0L0,0Z"
The above code implements the drawing logic of two nested circles. d3.arc() returns an arc constructor and sets the radius of the inner and outer circles, the starting angle and the ending angle through chain calls. Execute the arc() constructor to obtain path data for binding on
<!--html--> <svg width="960" height="500"></svg> <script> var arcGenerator = d3.arc().innerRadius(80).outerRadius(100).startAngle(0); var picture = d3.select('svg').append('g').attr('transform','translate(480,250)'); </script>
The above code implements 2 steps:
1. Generate an arc constructor with 0 degrees as the starting point arcGenerator
2. Set the offset of the transform graphic so that the graphic is in the center of the canvas.
There are currently no elements on the canvas. Next, we draw the actual graphic.
var backGround = picture.append("path")
  .datum({endAngle: 2 * Math.PI})
  .style("fill", "#FDF5E6")
.attr("d", arcGenerator);We add the

The first arc is drawn, then according to the hierarchical relationship z-index of svg, the so-called The progress bar is actually the second layer of arcs covering the first layer of arcs. In the same way, you can get:
var upperGround = picture.append('path')
  .datum({endAngle:Math.PI / 2})
  .style('fill','#FFC125')
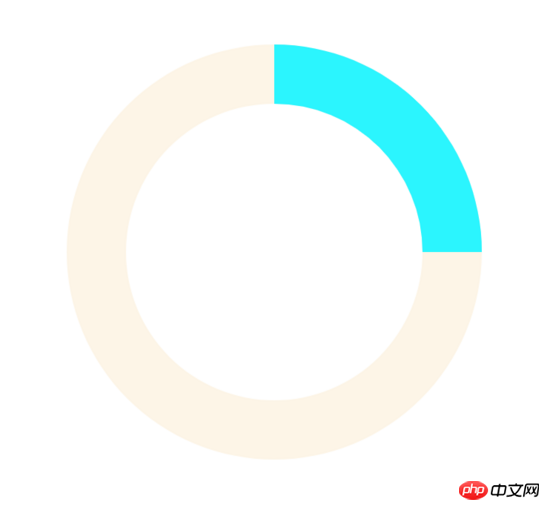
.attr('d',arcGenerator)After running the code, you can get:

2. Real-time data display at the center of the circle
In the first part, we have implemented a nested circle based on two paths. In the second part, we will implement real-time data display at the center of the circle. When the progress bar is loading, we add data at the center of the circle to express the current loading progress, and use the
var dataText = g.append('text')
  .text(12)
  .attr('text-anchor','middle')
  .attr('dominant-baseline','middle')
  .attr('font-size','38px')
Temporarily set the data to 12, and set the horizontal centering and vertical centering. The effect is as follows:

3. Show animation
通过1,2两部分内容我们已经知道了:
绘制进度条的实质是改变上层弧的角度
当弧度是 2π 时为整圆,当弧度是 π 时为半圆
圆形中的数据即为当前弧度相对 2π 的百分比
综上我们只要改变弧度值和数值同时设定改变过程所需时长即可实现所谓"动画"。在ECharts提供的官方实例中,通过 setInterval 来实现每隔固定一段时间进行数据更新,其实在D3.js中同样提供了类似方法来实现类似 setInterval 的功能:
d3.interval(function(){
 foreground.transition().duration(750).attrTween('d',function(d){
  var compute = d3.interpolate(d.endAngle,Math.random() * Math.PI * 2);
  return function(t){
   d.endAngle = compute(t);
   return arcGenerator(d);
  }

 })
},1000)对这段代码进行拆解:
d3.interval() 方法提供了 setInterval() 的功能
selection.transition.duration() 设置了当前DOM属性过渡变化为指定DOM属性的过程所需时间,毫秒为单位
transation.attrTween 为插值功能API,那么何谓插值?
概括来说,在给定的离散数据中补插函数,可以使这条连续函数通过全部数据点。举个例子,给定一个p,想实现其背景颜色的从左边红(red)到右边绿(green)的线性渐变,每一区域的色值该如何计算呢?只需:
var compute = d3.interpolate(d3.rgb(255,0,0),d3.rgb(0,255,0));
compute 即为插值函数,参数范围为[0,1],只要你输入该范围内的数字,那么 compute 函数将返回对应的颜色值。这样的插值有什么用呢?可看下图:

假设上图的p长度width为100,那么将[0,100]依比例关系转化为[0,10]的范围数据并输入 compute 函数中,即可得到某一区域对应的颜色。当然,对于线性面积的处理我们不应该使用离散数据作为输入和输出,所以D3.js提供更方便的线性渐变API d3.linear 等,这里就不展开描述了。
言归正传,代码 d3.interpolate(d.endAngle,Math.random() * Math.PI * 2); 实现了如下插值范围:
["当前角度值","随机角度值"] //表达区间而非数组
而后返回一个参数为 t 的函数,那么该函数的作用是什么呢?
t 参数与 d 类似,是D3.js内部实现的插值,其范围为[0,1]。 t 参数根据设置的 duration() 时长自动计算在[0,1]内合适的插值数量,并返回插值结果,实现线性平稳的过渡动画效果。
完成滚动条的动画加载效果,我们接下来写圆心实时数据的变化逻辑,只要实现简单的赋值即可,完整代码如下:
d3.interval(function(){
  foreground.transition().duration(750).attrTween('d',function(d){
   var compute = d3.interpolate(d.endAngle,Math.random() * Math.PI * 2);
   return function(t){
    d.endAngle = compute(t);
    var data = d.endAngle / Math.PI / 2 * 100;
    //设置数值
    d3.select('text').text(data.toFixed(0) + '%');
    //将新参数传入,生成新的圆弧构造器
    return arcGenerator(d);
   }
  })
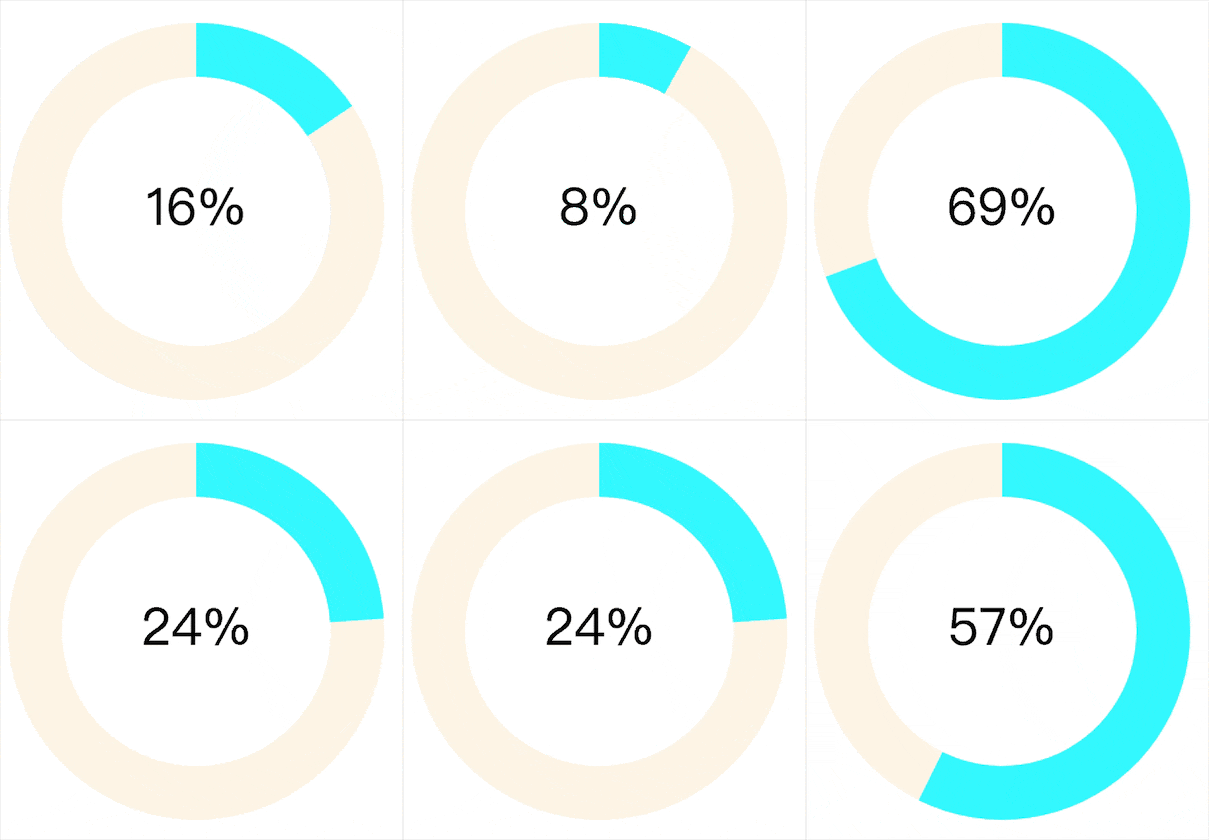
},2000)最终效果如下:

4.美化
1,2,3部分我们实现了最基本的进度条样式和功能,但样式看起来还是很单调的,我们接下来我们对进度条进行线性渐变处理。我们使用D3.js提供的线性插值API:
var colorLinear = d3.scaleLinear().domain([0,100]).range(["#EEE685","#EE3B3B"]);
colorLinear 同样是一个插值函数,我们输入[0,100]区间中的数值,就会返回对应["#EEE685","#EE3B3B"]区间内的颜色值。比如当进度条显示进度为"80%"时:
var color = colorLinear(80);
//color即为"80%"对应的色值
实现了颜色取值后,我们只需在进度条变化时,将原有颜色改变即可:
d3.interval(function(){
  foreground.transition().duration(750).attrTween('d',function(d){
   var compute = d3.interpolate(d.endAngle,Math.random() * Math.PI * 2);
   return function(t){
    d.endAngle = compute(t);
    var data = d.endAngle / Math.PI / 2 * 100;
    //设置数值
    d3.select('text').text(data.toFixed(0) + '%');
    //将新参数传入,生成新的圆弧构造器
    return arcGenerator(d);
   }
  })
  .styleTween('fill',function(d){
   return function(t){
    var data = d.endAngle / Math.PI / 2 * 100;
    //返回数值对应的色值
    return colorLinear(data);
   }
  })
},2000)styleTween 与 attrTween 类似,是实现改变样式的插值函数。采用链式调用的形式同时对进度条数值和颜色的设置即可。最终实现的效果如下:

综上我们实现了在不同数值下颜色变化的圆形进度条,可常用于告警,提醒等业务场景。
绘制矩形进度条
矩形进度条相比圆形进度条简单了很多,同样基于插值原理,平滑改变矩形的长度即可。直接上代码:
<head>
<style>
#slider {
height: 20px;
width: 20px;
background: #2394F5;
margin: 15px;
}
</style>
</head>
<body>
<p id='slider'></p>
<script>
d3.interval(function(){
d3.select("#slider").transition()
.duration(1000)
.attrTween("width", function() {
var i = d3.interpolate(20, 400);
var ci = d3.interpolate('#2394F5', '#BDF436');
var that = this;
return function(t) {
that.style.width = i(t) + 'px';
that.style.background = ci(t);
};
});
},1500)
</script>
</body>实现的效果如下:

总结
The key point of drawing a progress bar based on D3.js is interpolation, so as to correctly smooth the transition of graphics. If you must use svg or pure css to implement rectangular and circular progress bars, it is of course also feasible, but the processing of paths and animations, as well as the writing requirements of css, are much more complicated. We have observed that the logic code for drawing the above two progress bars using D3.js is almost entirely implemented using js. At the same time, the amount of code can be controlled at about 20 lines and can be encapsulated and reused. It is already very refined and is very useful in the development of custom charts. Advantage.
For the derivative version of the dashboard chart of the progress bar, compared with the basic progress bar, scale description and pointer calculation are added, but it remains the same. As long as you master the principle and use of interpolation, you will be able to handle similar charts with ease.
The above is what I compiled for everyone. I hope it will be helpful to everyone in the future.
Related articles:
Based on routing rules and methods of obtaining request parameters in express
js extracts the first letters of Chinese pinyin Encapsulation tool class_javascript skills
Detailed explanation of the simple use of vuex
The above is the detailed content of How to implement dynamic progress bar in D3.js. For more information, please follow other related articles on the PHP Chinese website!


