This article mainly introduces the method of integrating ANGULAR2 and D3.js to achieve customized visualization. The editor thinks it is quite good, so I will share it with you now and give it as a reference. Let’s follow the editor and take a look.
This article introduces the method of integrating ANGULAR2 and D3.js to achieve customized visualization. I would like to share it with you. The details are as follows:
Goal
Separation of presentation layer and logic layer
Separation of data and visual components
Two-way binding of data and view, real-time Update
The code structure is clear and easy to maintain and modify
Basic principles
Components of angular2 Life cycle hook method\parent-child component interaction mechanism\template syntax
Source code analysis
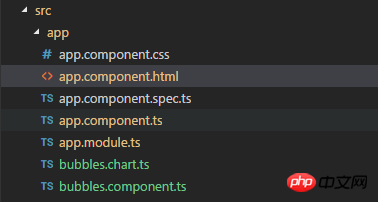
The code structure is very simple, except for the homepage index.html and main.ts The code structure is as follows:

Code structure
app.module.ts
import { BrowserModule } from '@angular/platform-browser';
import { NgModule } from '@angular/core';
import { FormsModule } from '@angular/forms';
//components
import { AppComponent } from './app.component';
import { Bubbles } from './bubbles.component';

@NgModule({
 declarations: [
  AppComponent,
  Bubbles
 ],
 imports: [
  BrowserModule,
  FormsModule
 ],
 providers: [],
 bootstrap: [AppComponent]
})
export class AppModule { }app.component.html
Implement host view definition,
2 buttons, the button can be bound to 2 click events, perform corresponding actions, refresh the array, and complete the update of the bubble chart at the same time;
1 A bubble chart sub-component, where values is the input attribute of the sub-component to realize communication between parent and child components, numArray is the input data array of the bubble chart, and the subsequent is a randomly generated array
<h1>
 <button (click)="refreshArr()" >开始刷新气泡图</button>
 <button (click)="stopRefresh()" >停止刷新气泡图</button>
 <bubbles [values]="numArray"></bubbles>
</h1>
app.component .ts
Refresh the data by specifying a timer that refreshes every 3 seconds. Note here that you need to clear the array first and then add elements. If you directly modify the array element value without changing the reference, the bubble cannot be refreshed. Figure
import { Component, OnDestroy, OnInit } from '@angular/core';
@Component({
 selector: 'app-root',
 templateUrl: './app.component.html',
 styleUrls: ['./app.component.css']
})
export class AppComponent implements OnInit, OnDestroy {
 intervalId = 0;
 numArray = [];
 // 清除定时器
 private clearTimer() {
  console.log('stop refreshing');
  clearInterval(this.intervalId);
 }
 // 生成指定范围内的随机数
 private getRandom(begin, end) {
  return Math.floor(Math.random() * (end - begin));
 }
 ngOnInit() {
  for (let i in this.numArray) {
   this.numArray[i] = this.getRandom(0, 100000000); // "0", "1", "2",
  };
 }
 // 元素关闭清除定时器
 ngOnDestroy() { this.clearTimer(); }
 // 启动定时刷新数组
 refreshArr() {
  this.clearTimer()
  this.intervalId = window.setInterval(() => {
   this.numArray = [];
   for (let i=0;i<8;i++)
   {
    this.numArray.push(this.getRandom(0, 100000000));
   }
  }, 3000);
 }
 // 停止定时刷新数组
 stopRefresh() {
  this.clearTimer();
 }
}bubbles.component.ts Bubble chart component class
ngOnChanges() life cycle method can be automatically called when the input attribute values change;
@ViewChild can get a reference to the child element svg, where the #target custom variable is used to identify the svg child element
import { Component, Input, OnChanges, AfterViewInit, ViewChild} from '@angular/core';
import {BubblesChart} from './bubbles.chart';
declare var d3;
@Component({
selector: 'bubbles',
template: '<svg #target width="900" height="300"></svg>',
})
export class Bubbles implements OnChanges, AfterViewInit {
@Input() values: number[];
chart: BubblesChart;
@ViewChild('target') target;//获得子组件的引用
constructor() {
}
// 每当元素对象上绑定的数据 输入属性值 values 发生变化时,执行下列函数,实现图表动态变化
ngOnChanges(changes) {
if (this.chart) {
// 先清空汽泡图,再重新调用汽泡图对象的render方法,根据变动后的值绘制图形
this.chart.destroy();
this.chart.render(changes.values.currentValue);
}
}
ngAfterViewInit() {
// 初始化汽泡图
this.chart = new BubblesChart(this.target.nativeElement);
this.chart.render(this.values);
}
}bubbles. chart.ts bubble chart class
d3.js syntax-defined bubble chart class, with a drawing method and erasing method
Need to introduce
declare var d3;
// define a bubble chart class
// Exports the visualization module
export class BubblesChart {
  target: HTMLElement;
  //构造函数, 基于一个 HTML元素对象内部来绘制
  constructor(target: HTMLElement) {
    this.target = target;
  }
  // 渲染 入参为数值 完成基于一个数组的 汽泡图的绘制
  render(values: number[]) {
    console.log('start rendering');
    console.log(values);
    d3.select(this.target)
      // Get the old circles
      .selectAll('circle')
      .data(values)
      .enter()
      // For each new data point, append a circle to the target SVG
      .append('circle')
      // Apply several style attributes to the circle
      .attr('r', d => Math.log(d)) // 半径
      .attr('fill', '#5fc') // 颜色
      .attr('stroke', '#333') // 轮廓颜色
      .attr('transform', (d, i) => { // 移动位置
        var offset = i * 30 + 3 * Math.log(d);
        return `translate(${offset}, ${offset})`;
      });
  }

  destroy() {
    d3.select(this.target).selectAll('circle').remove();
  }
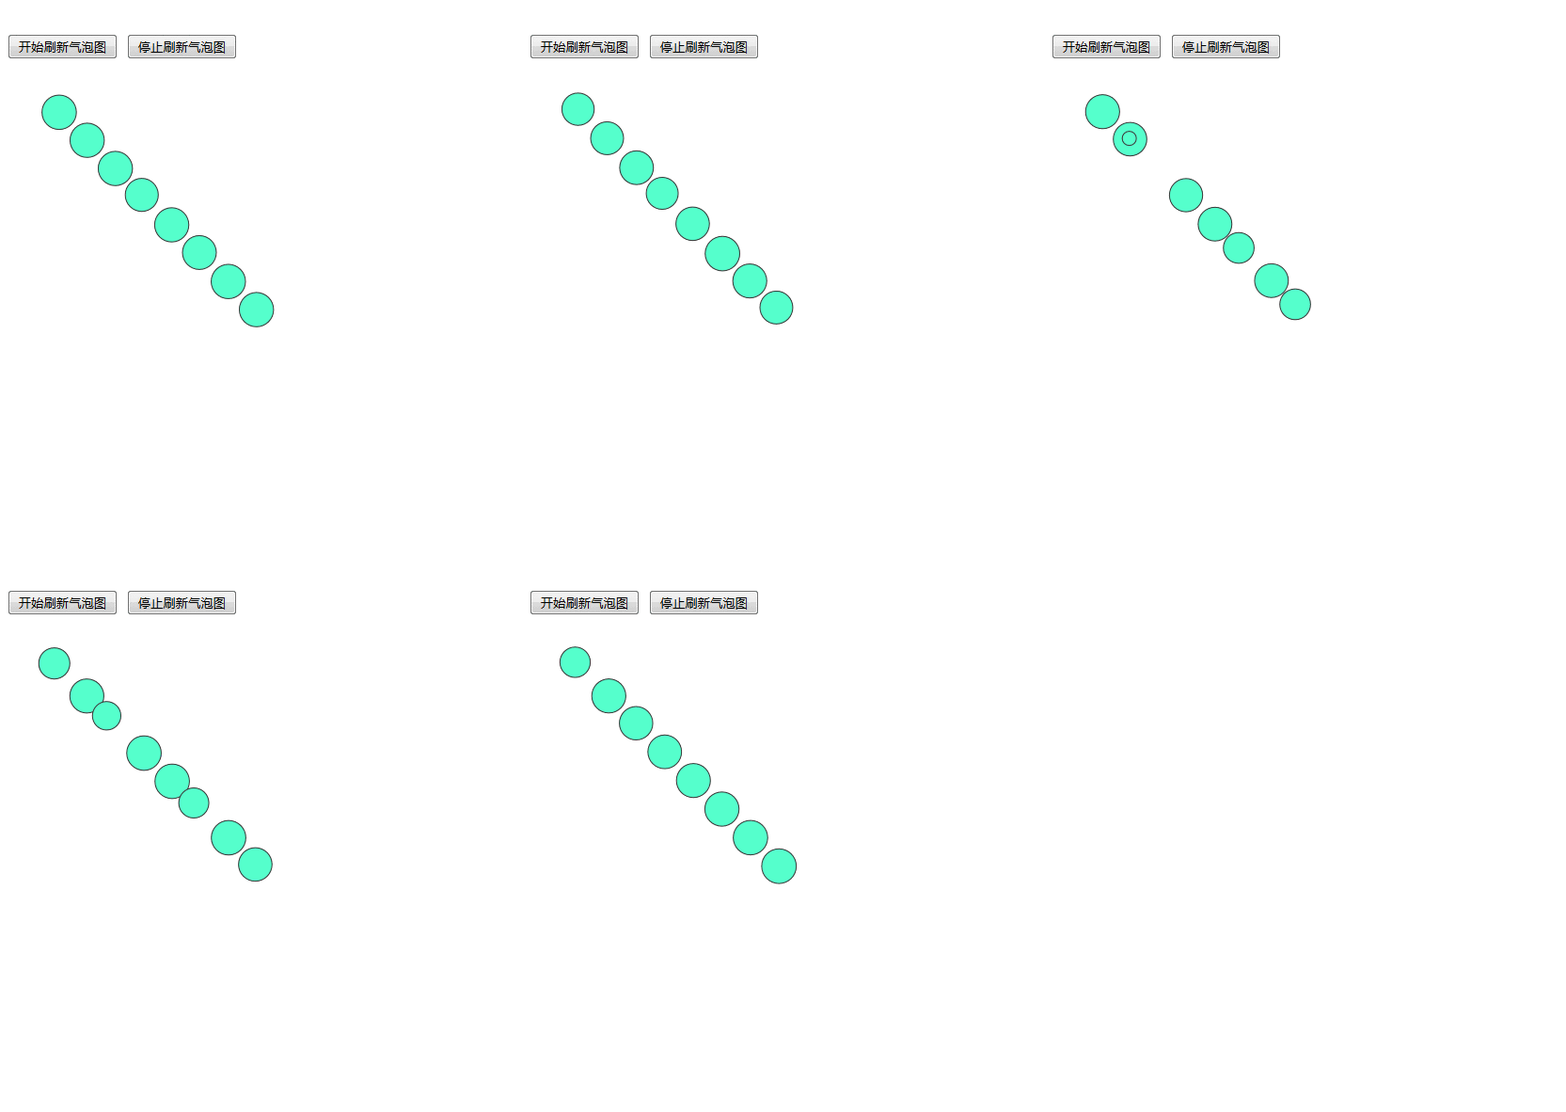
}Effect display# in index.html

How to implement cookie cross-domain in axios
In webpack, there is the environment configuration of jquery plug-in (details Tutorial)
How to implement paging query in Bootstrap4 Vue2
The above is the detailed content of How to implement custom visualization using AngularJS2 integrated with D3.js. For more information, please follow other related articles on the PHP Chinese website!


