

About how to use JS components in Gojs components
This article mainly introduces Gojs components, relevant information about front-end graphical plug-ins, which has certain reference value. Interested friends can refer to it
Foreword: I have shared two articles before Regarding the front-end component of process drawing, jsPlumb is used. This component itself is not bad. It is easy to use, easy to get started, and lightweight. However, after using it for a period of time, I found some shortcomings. For example, the component is not stable. When you first enter the page, the connection style is sometimes messed up. You need to refresh the page before you can Return to normal, and the wiring style is relatively simple, which can easily cause visual fatigue. In addition, the company has recently vigorously promoted the so-called "Industry 4.0". In addition to the increased requirements for automation control, the requirements for this graphical interface have also increased. Therefore, the effect of the simple jsPlumb component can no longer satisfy the growing company's business. Based on the above, I finally found the Gojs component, which has powerful effects and rich APIs. The only drawback is that this component is a paid component, but in China, hush... this is a secret that cannot be told!
Original address of this article: http://www.cnblogs.com/landeanfen/p/7910530.html
1. Component effect preview
Let’s start with two cool effects
Other Effect Examples
 ##Collapsible Tree
 Is this a picture?
 Can even generate charts!
 Want to grab Visio’s job?
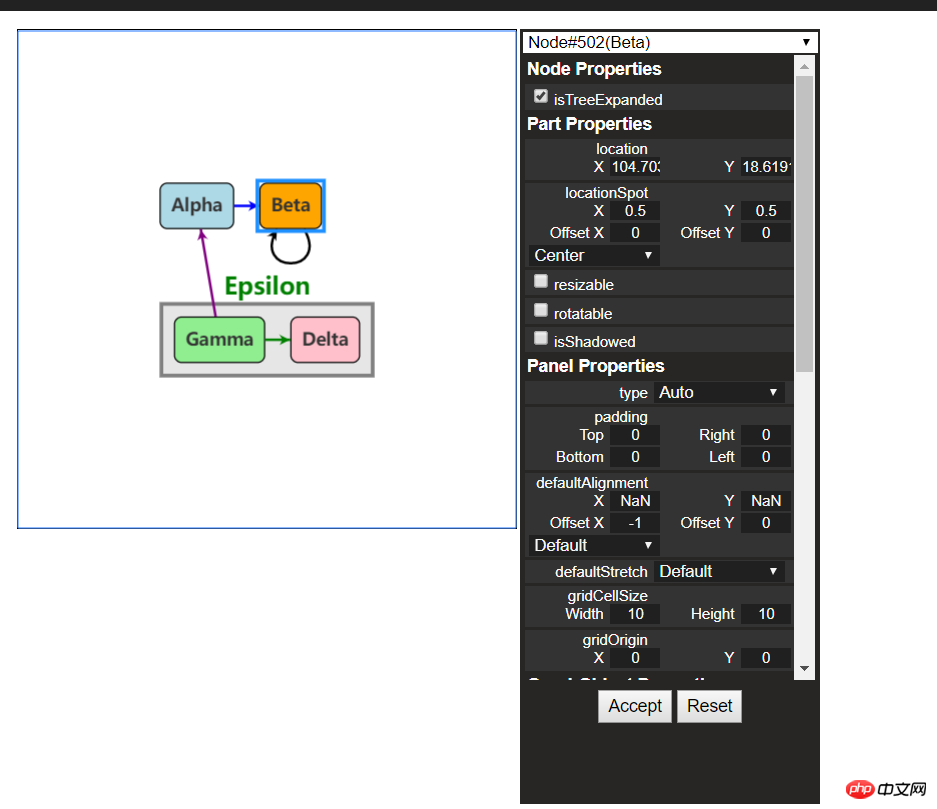 For more examples, please view the official website
old rules, let’s take an introductory tutorial first.
Source code download: https://github.com/NorthwoodsSoftware/GoJS
api details: https://gojs.net/latest/api/index.html
Sample address: https://gojs.net/latest/samples/index.html
1. Introduction to GojsGoJS is a function A rich JS library can realize customized interactive diagrams and complex visualization effects on web browsers and platforms. It uses custom templates and layout components to simplify complex JS diagrams such as nodes, links, and groups, providing user interaction with Many advanced features like drag and drop, copy, paste, text editing, tool tips, context menu, auto layout, templates, data binding and models, transaction state and undo management, palette, overview, event handlers, commands and an extended tool system for custom operations. GoJS enables user interaction and runs completely in the browser, rendering HTML5 Canvas elements or SVG without having to switch servers or plugins, and without server-side requests. GoJS does not depend on any JS library or framework (such as bootstrap, jquery, etc.) and can work with any HTML or JS framework, or even without a framework.
2. Getting started#(1) File reference
<script src="gojs/go-debug_ok.js"></script>
You can use the latest version on the cdn, or you can Reference the local down file. If it is development, you can quote the debug version of js, and quote the official js when running officially. There is no need to say more about this.
(2) Create canvas
随便定义一个html元素,作为我们的画布
<p id="myDiagramp" style="margin:auto;width:300px; height:300px; background-color:#ddd;"></p>
然后使用gojs的api初始化画布
//创建画布
  var objGo = go.GraphObject.make;
  var myDiagram = objGo(go.Diagram, "myDiagramp",
   {
    //模型图的中心位置所在坐标
    initialContentAlignment: go.Spot.Center,

    //允许用户操作图表的时候使用Ctrl-Z撤销和Ctrl-Y重做快捷键
    "undoManager.isEnabled": true,

    //不运行用户改变图表的规模
    allowZoom: false,

    //画布上面是否出现网格
    "grid.visible": true,

    //允许在画布上面双击的时候创建节点
    "clickCreatingTool.archetypeNodeData": { text: "Node" },

    //允许使用ctrl+c、ctrl+v复制粘贴
    "commandHandler.copiesTree": true,

    //允许使用delete键删除节点
    "commandHandler.deletesTree": true,

    // dragging for both move and copy
    "draggingTool.dragsTree": true,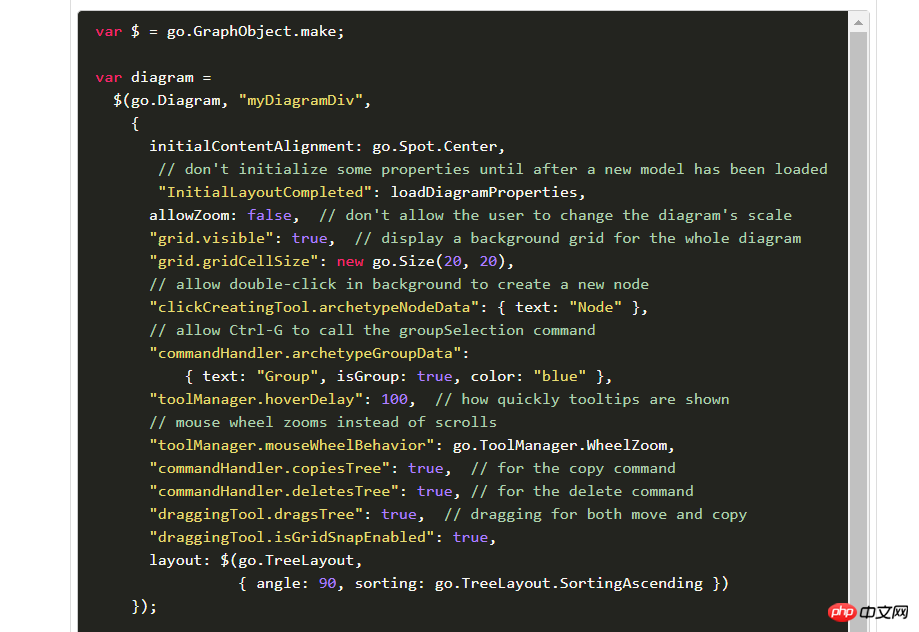
});官方示例用的$符号作为变量,博主觉得$符号太敏感,还是换个名字吧~以上几个参数都是博主摘选的,更多初始化画布的参数请参考官方api下图:
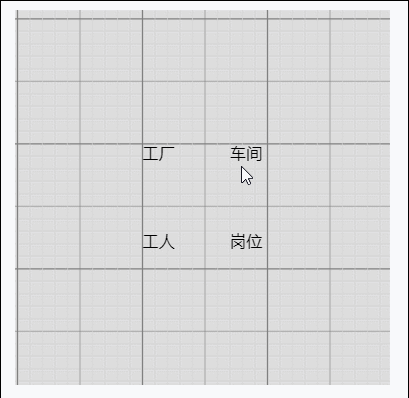
(3)创建模型数据(Model)
接着上面的代码,我们增加如下几行
var myModel = objGo(go.Model);//创建Model对象
  // model中的数据每一个js对象都代表着一个相应的模型图中的元素
  myModel.nodeDataArray = [
   { key: "工厂" },
   { key: "车间" },
   { key: "工人" },
   { key: "岗位" },
  ];
myDiagram.model = myModel; //将模型数据绑定到画布图上效果预览
(4)创建节点(Node)
上面有了画布和节点数据,只是有了一个雏形,但是还没有任何的图形化效果。我们加入一些效果试试
在gojs里面给我们提供了几种模型节点的可选项:
Shape:形状——Rectangle(矩形)、RoundedRectangle(圆角矩形),Ellipse(椭圆形),Triangle(三角形),Diamond(菱形),Circle(圆形)等
TextBlock:文本域(可编辑)
Picture:图片
Panel:容器来保存其他Node的集合
默认的节点模型代码只是由一个TextBlock组件构建成
我们增加如下一段代码
// 定义一个简单的节点模板
myDiagram.nodeTemplate =
objGo(go.Node, "Horizontal",//横向布局的面板
// 节点淡蓝色背景
{ background: "#44CCFF" },
objGo(go.Shape,
"RoundedRectangle", //定义形状,这是圆角矩形
{ /* Shape的参数。宽高颜色等等*/figure: "Club", width: 40, height: 60, margin: 4, fill: 'red' },
// 绑定 Shape.figure属性为Node.data.fig的值,Model对象可以通过Node.data.fig 获取和设置Shape.figure(修改形状)
new go.Binding("figure", "fig"), new go.Binding('fill', 'fill2')),
objGo(go.TextBlock,
"Default Text", // 默认文本
// 设置字体大小颜色以及边距
{ margin: 12, stroke: "white", font: "bold 16px sans-serif" },
//绑定TextBlock.text 属性为Node.data.name的值,Model对象可以通过Node.data.name获取和设置TextBlock.text
new go.Binding("text", "name"))
);
var myModel = objGo(go.Model);//创建Model对象
// model中的数据每一个js对象都代表着一个相应的模型图中的元素
myModel.nodeDataArray = [
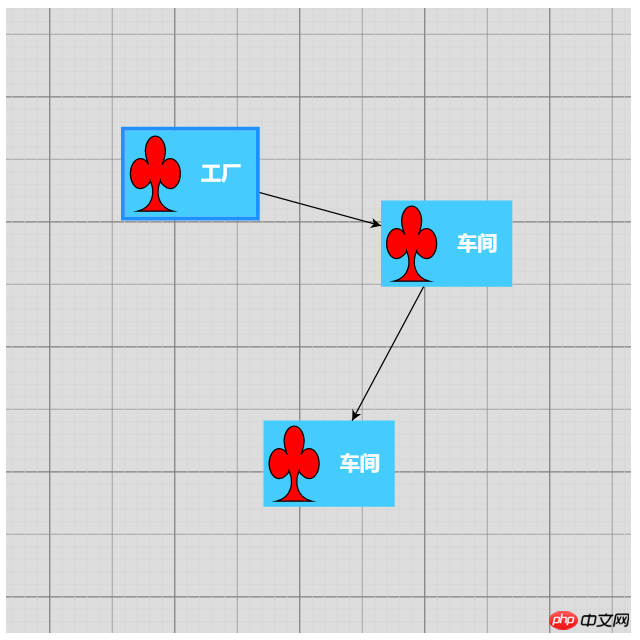
{ name: "工厂", fig: 'YinYang', fill2: 'blue' },
{ name: "车间", fig: 'Peace', fill2: 'red' },
{ name: "工人", fig: 'NotAllowed', fill2: 'green' },
{ name: "岗位", fig: 'Fragile', fill2: 'yellow' },
];
myDiagram.model = myModel; //将模型数据绑定到画布图上代码释疑:以上我们给画布对象定义了两种节点模板,一种是文本节点,另一种是形状节点(Node)。在形状节点中,我们定义了数据模型的通用节点样式,就是这一段代码{ /* Shape的参数。宽高颜色等等*/figure: "Club", width: 40, height: 60, margin: 4, fill: 'red' },然后通过new go.Binding("figure", "fig")方法将模板里面的属性映射到数据实例中,比如这里模板里面的figure属性定义的是Club,如果在我们的数据里面定义fig属性,那么它就会覆盖模板里面的figure的默认值。同样,fill和fill2也是通过同样的原理去区别模板中的样式和实例中的实际样式的!
注:更多figure属性的取值详见这里
效果如下
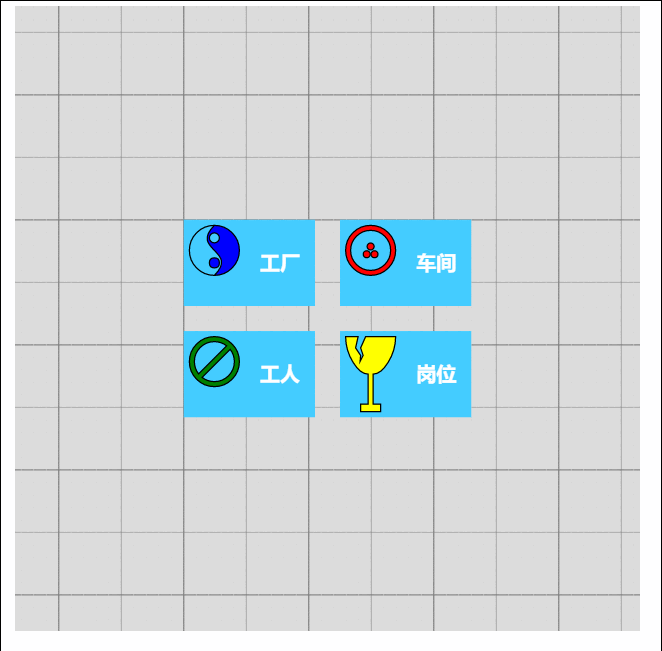
由此可见我们数据里面的属性会覆盖模板的原始属性,如果是新增的节点,由于没有自定义数据属性,所以呈现到界面上面的时候就是模板里面的原生样式!
(5)节点连线
有了上面的基础,我们可以在画布上面画出我们想要的图形效果了,可是还没有连线。我们知道连线是建立在节点模型的上面的,于是乎我们的Model又分为了以下三种类型:
Model:最基本的(不带连线,如上面的例子)
GraphLinksModel :高级点的动态连线图
TreeModel:树形图的模型(从例子看好像用的不多)
GraphLinksModel中为model.nodeDataArray提供model.linkDataArray为node节点连线保存数据模型信息,其实也是的一个JSON数组对象,每个线条都有两个属性 “to” 和 “from” 即Node节点的“key”值,两个属性代表两个key表示两个节点间的连线。
我们上面已经写过最基本的Model的例子了,我们再来个带连线的Model的示例
var myModel = objGo(go.GraphLinksModel);
  myModel.nodeDataArray =
   [
    { key: "aaa" ,name: "工厂" },
    { key: "bbb" ,name: "车间"},
    { key: "ccc" ,name: "车间" }
   ];
  myModel.linkDataArray =
   [
    { from: "aaa", to: "bbb" },
    { from: "bbb", to: "ccc" }
   ];
myDiagram.model = myModel;效果如下
学习了Model、GraphLinksModel,还剩下一种TreeModel树节点的模型,这个博主不打算做详细介绍,有兴趣可以直接查看官网。
三、综合效果
关于综合效果,博主不打算将gojs的api逐个翻个遍了,这样太耗时间,伤不起,只是将官方示例中的部分源码截取出来供大家参考。有需要的再细究!
1、自定义流程的使用
<!DOCTYPE html>
<html>
<head>
<meta name="viewport" content="width=device-width, initial-scale=1">
<title>Draggable Link</title>
<meta name="description" content="Drag a link to reconnect it. Nodes have custom Adornments for selection, resizing, and reshaping." />
<!-- Copyright 1998-2017 by Northwoods Software Corporation. -->
<meta charset="UTF-8">
<script src="../../gojs/go-debug.js"></script>
<script id="code">
function init() {
if (window.goSamples) goSamples(); // init for these samples -- you don't need to call this
var objGo = go.GraphObject.make; // for conciseness in defining templates
myDiagram =
objGo(go.Diagram, "myDiagramp", // must name or refer to the p HTML element
{
grid: objGo(go.Panel, "Grid",
objGo(go.Shape, "LineH", { stroke: "lightgray", strokeWidth: 0.5 }),
objGo(go.Shape, "LineH", { stroke: "gray", strokeWidth: 0.5, interval: 10 }),
objGo(go.Shape, "LineV", { stroke: "lightgray", strokeWidth: 0.5 }),
objGo(go.Shape, "LineV", { stroke: "gray", strokeWidth: 0.5, interval: 10 })
),
allowDrop: true, // must be true to accept drops from the Palette
"draggingTool.dragsLink": true,
"draggingTool.isGridSnapEnabled": true,
"linkingTool.isUnconnectedLinkValid": true,
"linkingTool.portGravity": 20,
"relinkingTool.isUnconnectedLinkValid": true,
"relinkingTool.portGravity": 20,
"relinkingTool.fromHandleArchetype":
objGo(go.Shape, "Diamond", { segmentIndex: 0, cursor: "pointer", desiredSize: new go.Size(8, 8), fill: "tomato", stroke: "darkred" }),
"relinkingTool.toHandleArchetype":
objGo(go.Shape, "Diamond", { segmentIndex: -1, cursor: "pointer", desiredSize: new go.Size(8, 8), fill: "darkred", stroke: "tomato" }),
"linkReshapingTool.handleArchetype":
objGo(go.Shape, "Diamond", { desiredSize: new go.Size(7, 7), fill: "lightblue", stroke: "deepskyblue" }),
rotatingTool: objGo(TopRotatingTool), // defined below
"rotatingTool.snapAngleMultiple": 15,
"rotatingTool.snapAngleEpsilon": 15,
"undoManager.isEnabled": true
});
// when the document is modified, add a "*" to the title and enable the "Save" button
myDiagram.addDiagramListener("Modified", function(e) {
var button = document.getElementById("SaveButton");
if (button) button.disabled = !myDiagram.isModified;
var idx = document.title.indexOf("*");
if (myDiagram.isModified) {
if (idx < 0) document.title += "*";
} else {
if (idx >= 0) document.title = document.title.substr(0, idx);
}
});
// Define a function for creating a "port" that is normally transparent.
// The "name" is used as the GraphObject.portId, the "spot" is used to control how links connect
// and where the port is positioned on the node, and the boolean "output" and "input" arguments
// control whether the user can draw links from or to the port.
function makePort(name, spot, output, input) {
// the port is basically just a small transparent square
return objGo(go.Shape, "Circle",
{
fill: null, // not seen, by default; set to a translucent gray by showSmallPorts, defined below
stroke: null,
desiredSize: new go.Size(7, 7),
alignment: spot, // align the port on the main Shape
alignmentFocus: spot, // just inside the Shape
portId: name, // declare this object to be a "port"
fromSpot: spot, toSpot: spot, // declare where links may connect at this port
fromLinkable: output, toLinkable: input, // declare whether the user may draw links to/from here
cursor: "pointer" // show a different cursor to indicate potential link point
});
}
var nodeSelectionAdornmentTemplate =
objGo(go.Adornment, "Auto",
objGo(go.Shape, { fill: null, stroke: "deepskyblue", strokeWidth: 1.5, strokeDashArray: [4, 2] }),
objGo(go.Placeholder)
);
var nodeResizeAdornmentTemplate =
objGo(go.Adornment, "Spot",
{ locationSpot: go.Spot.Right },
objGo(go.Placeholder),
objGo(go.Shape, { alignment: go.Spot.TopLeft, cursor: "nw-resize", desiredSize: new go.Size(6, 6), fill: "lightblue", stroke: "deepskyblue" }),
objGo(go.Shape, { alignment: go.Spot.Top, cursor: "n-resize", desiredSize: new go.Size(6, 6), fill: "lightblue", stroke: "deepskyblue" }),
objGo(go.Shape, { alignment: go.Spot.TopRight, cursor: "ne-resize", desiredSize: new go.Size(6, 6), fill: "lightblue", stroke: "deepskyblue" }),
objGo(go.Shape, { alignment: go.Spot.Left, cursor: "w-resize", desiredSize: new go.Size(6, 6), fill: "lightblue", stroke: "deepskyblue" }),
objGo(go.Shape, { alignment: go.Spot.Right, cursor: "e-resize", desiredSize: new go.Size(6, 6), fill: "lightblue", stroke: "deepskyblue" }),
objGo(go.Shape, { alignment: go.Spot.BottomLeft, cursor: "se-resize", desiredSize: new go.Size(6, 6), fill: "lightblue", stroke: "deepskyblue" }),
objGo(go.Shape, { alignment: go.Spot.Bottom, cursor: "s-resize", desiredSize: new go.Size(6, 6), fill: "lightblue", stroke: "deepskyblue" }),
objGo(go.Shape, { alignment: go.Spot.BottomRight, cursor: "sw-resize", desiredSize: new go.Size(6, 6), fill: "lightblue", stroke: "deepskyblue" })
);
var nodeRotateAdornmentTemplate =
objGo(go.Adornment,
{ locationSpot: go.Spot.Center, locationObjectName: "CIRCLE" },
objGo(go.Shape, "Circle", { name: "CIRCLE", cursor: "pointer", desiredSize: new go.Size(7, 7), fill: "lightblue", stroke: "deepskyblue" }),
objGo(go.Shape, { geometryString: "M3.5 7 L3.5 30", isGeometryPositioned: true, stroke: "deepskyblue", strokeWidth: 1.5, strokeDashArray: [4, 2] })
);
myDiagram.nodeTemplate =
objGo(go.Node, "Spot",
{ locationSpot: go.Spot.Center },
new go.Binding("location", "loc", go.Point.parse).makeTwoWay(go.Point.stringify),
{ selectable: true, selectionAdornmentTemplate: nodeSelectionAdornmentTemplate },
{ resizable: true, resizeObjectName: "PANEL", resizeAdornmentTemplate: nodeResizeAdornmentTemplate },
{ rotatable: true, rotateAdornmentTemplate: nodeRotateAdornmentTemplate },
new go.Binding("angle").makeTwoWay(),
// the main object is a Panel that surrounds a TextBlock with a Shape
objGo(go.Panel, "Auto",
{ name: "PANEL" },
new go.Binding("desiredSize", "size", go.Size.parse).makeTwoWay(go.Size.stringify),
objGo(go.Shape, "Rectangle", // default figure
{
portId: "", // the default port: if no spot on link data, use closest side
fromLinkable: true, toLinkable: true, cursor: "pointer",
fill: "white", // default color
strokeWidth: 2
},
new go.Binding("figure"),
new go.Binding("fill")),
objGo(go.TextBlock,
{
font: "bold 11pt Helvetica, Arial, sans-serif",
margin: 8,
maxSize: new go.Size(160, NaN),
wrap: go.TextBlock.WrapFit,
editable: true
},
new go.Binding("text").makeTwoWay())
),
// four small named ports, one on each side:
makePort("T", go.Spot.Top, false, true),
makePort("L", go.Spot.Left, true, true),
makePort("R", go.Spot.Right, true, true),
makePort("B", go.Spot.Bottom, true, false),
{ // handle mouse enter/leave events to show/hide the ports
mouseEnter: function(e, node) { showSmallPorts(node, true); },
mouseLeave: function(e, node) { showSmallPorts(node, false); }
}
);
function showSmallPorts(node, show) {
node.ports.each(function(port) {
if (port.portId !== "") { // don't change the default port, which is the big shape
port.fill = show ? "rgba(0,0,0,.3)" : null;
}
});
}
var linkSelectionAdornmentTemplate =
objGo(go.Adornment, "Link",
objGo(go.Shape,
// isPanelMain declares that this Shape shares the Link.geometry
{ isPanelMain: true, fill: null, stroke: "deepskyblue", strokeWidth: 0 }) // use selection object's strokeWidth
);
myDiagram.linkTemplate =
objGo(go.Link, // the whole link panel
{ selectable: true, selectionAdornmentTemplate: linkSelectionAdornmentTemplate },
{ relinkableFrom: true, relinkableTo: true, reshapable: true },
{
routing: go.Link.AvoidsNodes,
curve: go.Link.JumpOver,
corner: 5,
toShortLength: 4
},
new go.Binding("points").makeTwoWay(),
objGo(go.Shape, // the link path shape
{ isPanelMain: true, strokeWidth: 2 }),
objGo(go.Shape, // the arrowhead
{ toArrow: "Standard", stroke: null }),
objGo(go.Panel, "Auto",
new go.Binding("visible", "isSelected").ofObject(),
objGo(go.Shape, "RoundedRectangle", // the link shape
{ fill: "#F8F8F8", stroke: null }),
objGo(go.TextBlock,
{
textAlign: "center",
font: "10pt helvetica, arial, sans-serif",
stroke: "#919191",
margin: 2,
minSize: new go.Size(10, NaN),
editable: true
},
new go.Binding("text").makeTwoWay())
)
);
load(); // load an initial diagram from some JSON text
// initialize the Palette that is on the left side of the page
myPalette =
objGo(go.Palette, "myPalettep", // must name or refer to the p HTML element
{
maxSelectionCount: 1,
nodeTemplateMap: myDiagram.nodeTemplateMap, // share the templates used by myDiagram
linkTemplate: // simplify the link template, just in this Palette
objGo(go.Link,
{ // because the GridLayout.alignment is Location and the nodes have locationSpot == Spot.Center,
// to line up the Link in the same manner we have to pretend the Link has the same location spot
locationSpot: go.Spot.Center,
selectionAdornmentTemplate:
objGo(go.Adornment, "Link",
{ locationSpot: go.Spot.Center },
objGo(go.Shape,
{ isPanelMain: true, fill: null, stroke: "deepskyblue", strokeWidth: 0 }),
objGo(go.Shape, // the arrowhead
{ toArrow: "Standard", stroke: null })
)
},
{
routing: go.Link.AvoidsNodes,
curve: go.Link.JumpOver,
corner: 5,
toShortLength: 4
},
new go.Binding("points"),
objGo(go.Shape, // the link path shape
{ isPanelMain: true, strokeWidth: 2 }),
objGo(go.Shape, // the arrowhead
{ toArrow: "Standard", stroke: null })
),
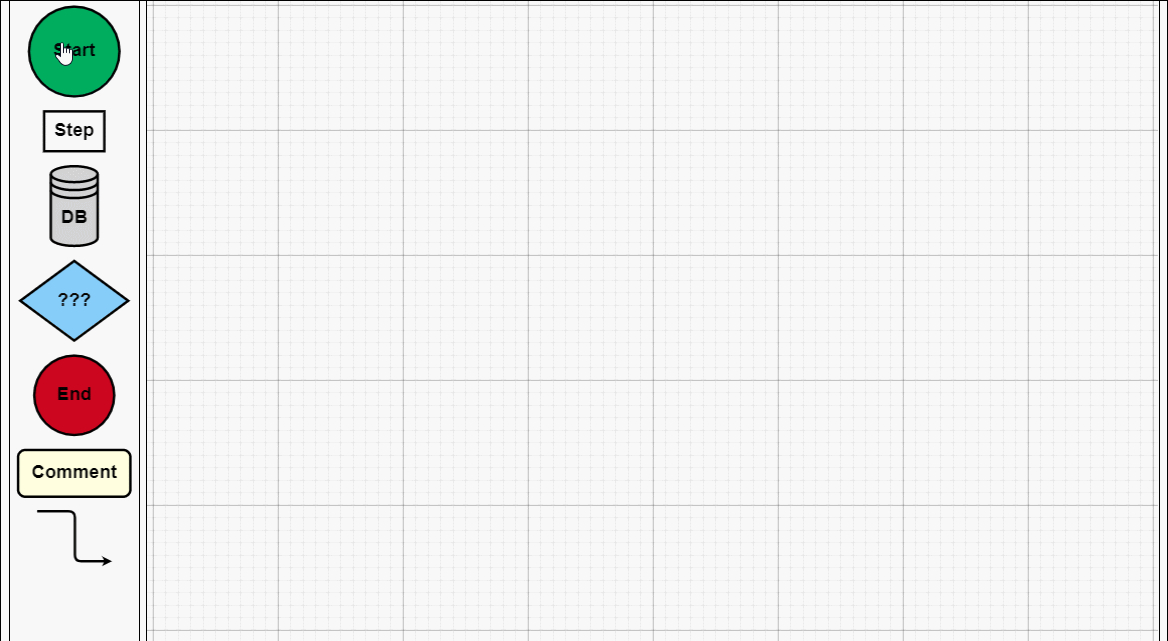
model: new go.GraphLinksModel([ // specify the contents of the Palette
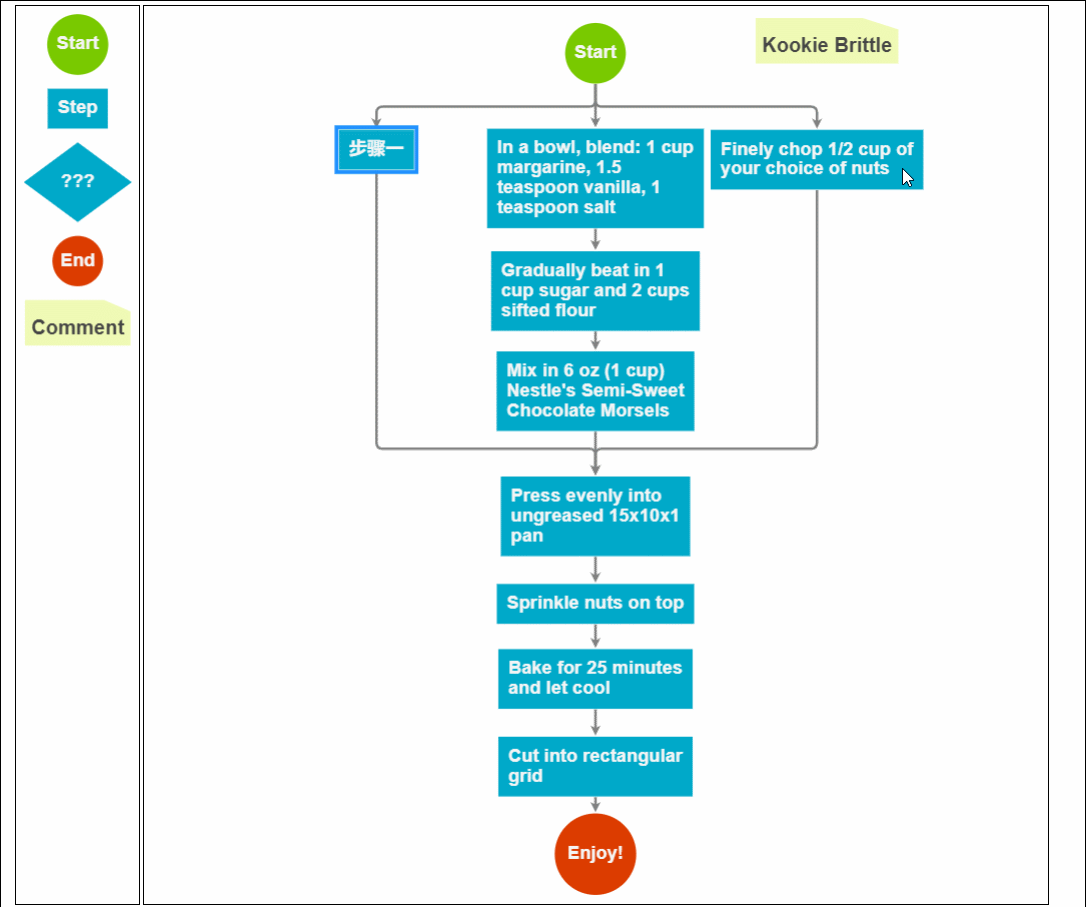
{ text: "Start", figure: "Circle", fill: "#00AD5F" },
{ text: "Step" },
{ text: "DB", figure: "Database", fill: "lightgray" },
{ text: "???", figure: "Diamond", fill: "lightskyblue" },
{ text: "End", figure: "Circle", fill: "#CE0620" },
{ text: "Comment", figure: "RoundedRectangle", fill: "lightyellow" }
], [
// the Palette also has a disconnected Link, which the user can drag-and-drop
{ points: new go.List(go.Point).addAll([new go.Point(0, 0), new go.Point(30, 0), new go.Point(30, 40), new go.Point(60, 40)]) }
])
});
}
function TopRotatingTool() {
go.RotatingTool.call(this);
}
go.Diagram.inherit(TopRotatingTool, go.RotatingTool);
/** @override */
TopRotatingTool.prototype.updateAdornments = function(part) {
go.RotatingTool.prototype.updateAdornments.call(this, part);
var adornment = part.findAdornment("Rotating");
if (adornment !== null) {
adornment.location = part.rotateObject.getDocumentPoint(new go.Spot(0.5, 0, 0, -30)); // above middle top
}
};
/** @override */
TopRotatingTool.prototype.rotate = function(newangle) {
go.RotatingTool.prototype.rotate.call(this, newangle + 90);
};
// end of TopRotatingTool class
// Show the diagram's model in JSON format that the user may edit
function save() {
saveDiagramProperties(); // do this first, before writing to JSON
document.getElementById("mySavedModel").value = myDiagram.model.toJson();
myDiagram.isModified = false;
}
function load() {
myDiagram.model = go.Model.fromJson(document.getElementById("mySavedModel").value);
loadDiagramProperties(); // do this after the Model.modelData has been brought into memory
}
function saveDiagramProperties() {
myDiagram.model.modelData.position = go.Point.stringify(myDiagram.position);
}
function loadDiagramProperties(e) {
// set Diagram.initialPosition, not Diagram.position, to handle initialization side-effects
var pos = myDiagram.model.modelData.position;
if (pos) myDiagram.initialPosition = go.Point.parse(pos);
}
</script>
</head>
<body onload="init()">
<p id="sample">
<p style="width:100%; white-space:nowrap;">
<span style="display: inline-block; vertical-align: top; width:105px">
<p id="myPalettep" style="border: solid 1px black; height: 620px"></p>
</span>
<span style="display: inline-block; vertical-align: top; width:80%">
<p id="myDiagramp" style="border: solid 1px black; height: 620px"></p>
</span>
</p>
<p>
This sample demonstrates the ability for the user to drag around a Link as if it were a Node.
When either end of the link passes over a valid port, the port is highlighted.
</p>
<p>
The link-dragging functionality is enabled by setting some or all of the following properties:
<a>DraggingTool.dragsLink</a>, <a>LinkingTool.isUnconnectedLinkValid</a>, and
<a>RelinkingTool.isUnconnectedLinkValid</a>.
</p>
<p>
Note that a Link is present in the <a>Palette</a> so that it too can be dragged out and onto
the main Diagram. Because links are not automatically routed when either end is not connected
with a Node, the route is provided explicitly when that Palette item is defined.
</p>
<p>
This also demonstrates several custom Adornments:
<a>Part.selectionAdornmentTemplate</a>, <a>Part.resizeAdornmentTemplate</a>, and
<a>Part.rotateAdornmentTemplate</a>.
</p>
<p>
Finally this sample demonstrates saving and restoring the <a>Diagram.position</a> as a property
on the <a>Model.modelData</a> object that is automatically saved and restored when calling <a>Model.toJson</a>
and <a>Model.fromJson</a>.
</p>
<p>
<p>
<button id="SaveButton" onclick="save()">Save</button>
<button onclick="load()">Load</button>
Diagram Model saved in JSON format:
</p>
<textarea id="mySavedModel" style="width:100%;height:300px">
{ "class": "go.GraphLinksModel",
"linkFromPortIdProperty": "fromPort",
"linkToPortIdProperty": "toPort",
"nodeDataArray": [
],
"linkDataArray": [
]}
</textarea>
</p>
</p>
</body>
</html>效果如下:
建议各位copy代码,在本地看到效果,然后再根据实际需求去研究它的api,这样才不会太盲目而花费太多时间。
2、工业流程图
<!DOCTYPE html>
<html>
<head>
<meta name="viewport" content="width=device-width, initial-scale=1">
<title>Process Flow</title>
<meta name="description" content="A simple process flow or SCADA diagram editor, simulating equipment monitoring and control." />
<!-- Copyright 1998-2017 by Northwoods Software Corporation. -->
<meta charset="UTF-8">
<script src="../../gojs/go-debug.js"></script>
<script id="code">
function init() {
if (window.goSamples) goSamples(); // init for these samples -- you don't need to call this
var $ = go.GraphObject.make; // for more concise visual tree definitions
myDiagram =
$(go.Diagram, "myDiagramp",
{
"grid.visible": true,
"grid.gridCellSize": new go.Size(30, 20),
"draggingTool.isGridSnapEnabled": true,
"resizingTool.isGridSnapEnabled": true,
"rotatingTool.snapAngleMultiple": 90,
"rotatingTool.snapAngleEpsilon": 45,
"undoManager.isEnabled": true
});
// when the document is modified, add a "*" to the title and enable the "Save" button
myDiagram.addDiagramListener("Modified", function(e) {
var button = document.getElementById("SaveButton");
if (button) button.disabled = !myDiagram.isModified;
var idx = document.title.indexOf("*");
if (myDiagram.isModified) {
if (idx < 0) document.title += "*";
} else {
if (idx >= 0) document.title = document.title.substr(0, idx);
}
});
myDiagram.nodeTemplateMap.add("Process",
$(go.Node, "Auto",
{ locationSpot: new go.Spot(0.5, 0.5), locationObjectName: "SHAPE",
resizable: true, resizeObjectName: "SHAPE" },
new go.Binding("location", "pos", go.Point.parse).makeTwoWay(go.Point.stringify),
$(go.Shape, "Cylinder1",
{ name: "SHAPE",
strokeWidth: 2,
fill: $(go.Brush, "Linear",
{ start: go.Spot.Left, end: go.Spot.Right,
0: "gray", 0.5: "white", 1: "gray" }),
minSize: new go.Size(50, 50),
portId: "", fromSpot: go.Spot.AllSides, toSpot: go.Spot.AllSides
},
new go.Binding("desiredSize", "size", go.Size.parse).makeTwoWay(go.Size.stringify)),
$(go.TextBlock,
{ alignment: go.Spot.Center, textAlign: "center", margin: 5,
editable: true },
new go.Binding("text").makeTwoWay())
));
myDiagram.nodeTemplateMap.add("Valve",
$(go.Node, "Vertical",
{ locationSpot: new go.Spot(0.5, 1, 0, -21), locationObjectName: "SHAPE",
selectionObjectName: "SHAPE", rotatable: true },
new go.Binding("angle").makeTwoWay(),
new go.Binding("location", "pos", go.Point.parse).makeTwoWay(go.Point.stringify),
$(go.TextBlock,
{ alignment: go.Spot.Center, textAlign: "center", margin: 5, editable: true },
new go.Binding("text").makeTwoWay(),
// keep the text upright, even when the whole node has been rotated upside down
new go.Binding("angle", "angle", function(a) { return a === 180 ? 180 : 0; }).ofObject()),
$(go.Shape,
{ name: "SHAPE",
geometryString: "F1 M0 0 L40 20 40 0 0 20z M20 10 L20 30 M12 30 L28 30",
strokeWidth: 2,
fill: $(go.Brush, "Linear", { 0: "gray", 0.35: "white", 0.7: "gray" }),
portId: "", fromSpot: new go.Spot(1, 0.35), toSpot: new go.Spot(0, 0.35) })
));
myDiagram.linkTemplate =
$(go.Link,
{ routing: go.Link.AvoidsNodes, curve: go.Link.JumpGap, corner: 10, reshapable: true, toShortLength: 7 },
new go.Binding("points").makeTwoWay(),
// mark each Shape to get the link geometry with isPanelMain: true
$(go.Shape, { isPanelMain: true, stroke: "black", strokeWidth: 5 }),
$(go.Shape, { isPanelMain: true, stroke: "gray", strokeWidth: 3 }),
$(go.Shape, { isPanelMain: true, stroke: "white", strokeWidth: 1, name: "PIPE", strokeDashArray: [10, 10] }),
$(go.Shape, { toArrow: "Triangle", fill: "black", stroke: null })
);
load();
loop(); // animate some flow through the pipes
}
function loop() {
var diagram = myDiagram;
setTimeout(function() {
var oldskips = diagram.skipsUndoManager;
diagram.skipsUndoManager = true;
diagram.links.each(function(link) {
var shape = link.findObject("PIPE");
var off = shape.strokeDashOffset - 2;
shape.strokeDashOffset = (off <= 0) ? 20 : off;
});
diagram.skipsUndoManager = oldskips;
loop();
}, 100);
}
function save() {
document.getElementById("mySavedModel").value = myDiagram.model.toJson();
myDiagram.isModified = false;
}
function load() {
myDiagram.model = go.Model.fromJson(document.getElementById("mySavedModel").value);
}
</script>
</head>
<body onload="init()">
<p id="sample">
<p id="myDiagramp" style="border: solid 1px black; width:100%; height:500px"></p>
<p>
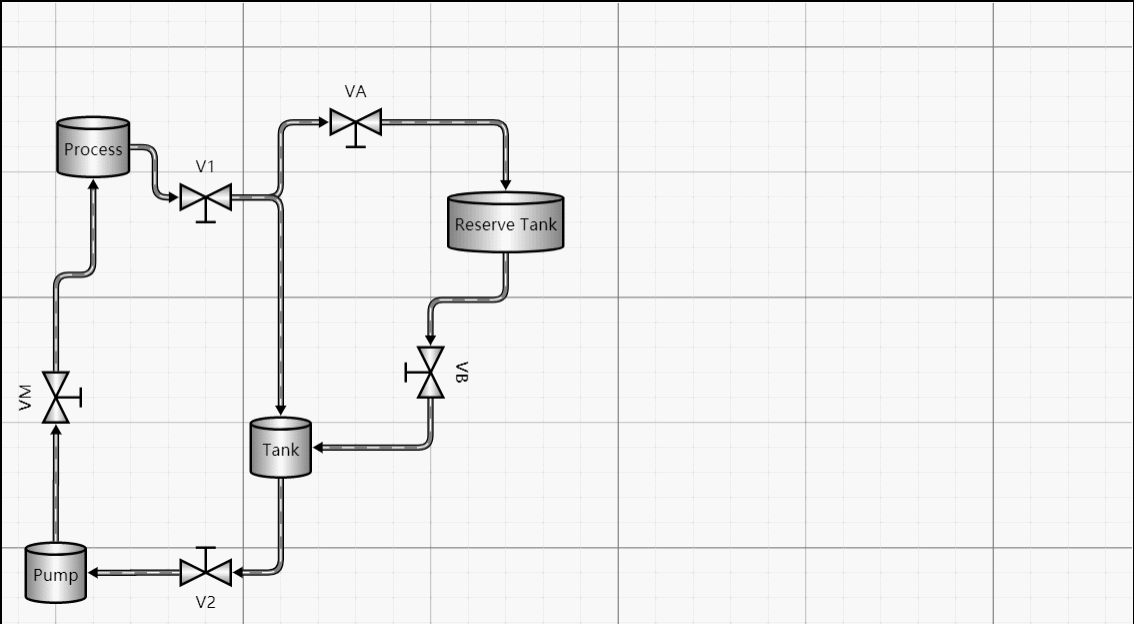
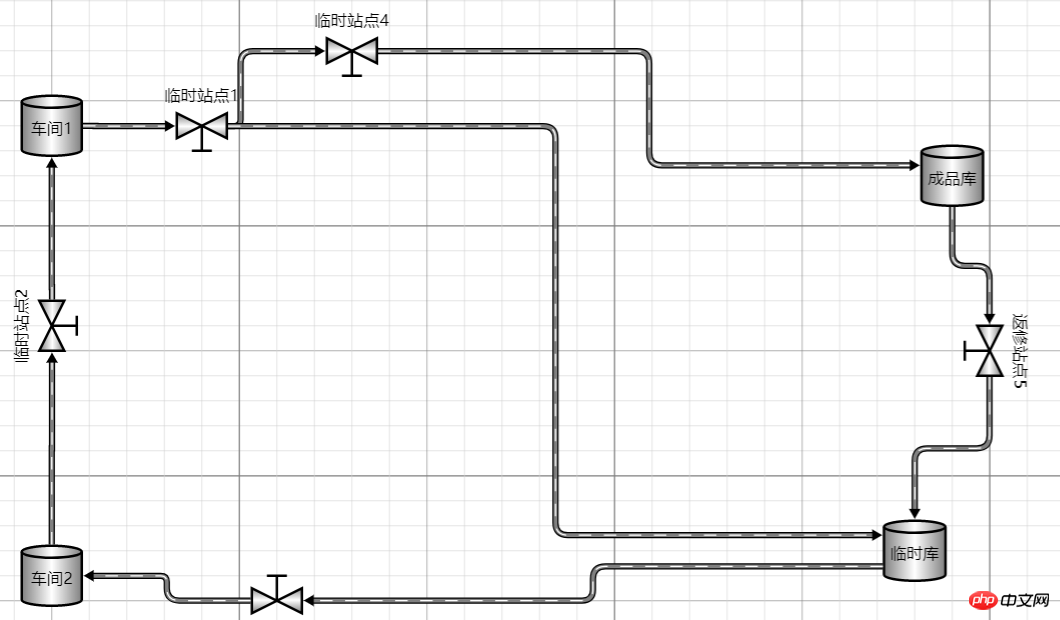
A <em>process flow diagram</em> is commonly used in chemical and process engineering to indicate the general flow of plant processes and equipment.
A simple SCADA diagram, with animation of the flow along the pipes, is implemented here.
</p>
<p>
The diagram displays the background grid layer by setting <b>grid.visible</b> to true,
and also allows snapping to the grid using <a>DraggingTool.isGridSnapEnabled</a>,
<a>ResizingTool.isGridSnapEnabled</a>, and <a>RotatingTool.snapAngleMultiple</a> alongside <a>RotatingTool.snapAngleEpsilon</a>.
</p>
<p>
The diagram also uses the <b>loop</b> function to animate the links by adjusting the <a>Shape.strokeDashOffset</a> every 100 ms.
</p>
<p>
<p>
<button id="SaveButton" onclick="save()">Save</button>
<button onclick="load()">Load</button>
Diagram Model saved in JSON format:
</p>
<textarea id="mySavedModel" style="width:100%;height:300px">
{ "class": "go.GraphLinksModel",
"nodeDataArray": [
{"key":"P1", "category":"Process", "pos":"150 120", "text":"Process"},
{"key":"P2", "category":"Process", "pos":"330 320", "text":"Tank"},
{"key":"V1", "category":"Valve", "pos":"270 120", "text":"V1"},
{"key":"P3", "category":"Process", "pos":"150 420", "text":"Pump"},
{"key":"V2", "category":"Valve", "pos":"150 280", "text":"VM", "angle":270},
{"key":"V3", "category":"Valve", "pos":"270 420", "text":"V2", "angle":180},
{"key":"P4", "category":"Process", "pos":"450 140", "text":"Reserve Tank"},
{"key":"V4", "category":"Valve", "pos":"390 60", "text":"VA"},
{"key":"V5", "category":"Valve", "pos":"450 260", "text":"VB", "angle":90}
],
"linkDataArray": [
{"from":"P1", "to":"V1"},
{"from":"P3", "to":"V2"},
{"from":"V2", "to":"P1"},
{"from":"P2", "to":"V3"},
{"from":"V3", "to":"P3"},
{"from":"V1", "to":"V4"},
{"from":"V4", "to":"P4"},
{"from":"V1", "to":"P2"},
{"from":"P4", "to":"V5"},
{"from":"V5", "to":"P2"}
]}
</textarea>
</p>
</p>
</body>
</html>工业流程图
四、总结
This article gives a brief introduction based on some basic usage of js. I will stop here today and share with you if you have any questions in the future. If your project also has this kind of business need, you can try it out! It should be noted that if your company is not short of money, it is recommended to use genuine authorized components. After all, it is important to respect the fruits of the author's labor!
The above is what I compiled for everyone. I hope it will be helpful to everyone in the future.
Related articles:
How to implement the like function in the WeChat mini program
Detailed interpretation and analysis of JavaScript code modules
How to implement todoList through the upgraded version of react redux
Compatibility and error-prone problems that easily occur in js
How to implement asynchronous loading issues in HTML5 JS JQuery ECharts
The above is the detailed content of About how to use JS components in Gojs components. For more information, please follow other related articles on the PHP Chinese website!

Hot AI Tools

Undresser.AI Undress
AI-powered app for creating realistic nude photos

AI Clothes Remover
Online AI tool for removing clothes from photos.

Undress AI Tool
Undress images for free

Clothoff.io
AI clothes remover

Video Face Swap
Swap faces in any video effortlessly with our completely free AI face swap tool!

Hot Article
Hot Tools

Notepad++7.3.1
Easy-to-use and free code editor

SublimeText3 Chinese version
Chinese version, very easy to use

Zend Studio 13.0.1
Powerful PHP integrated development environment

Dreamweaver CS6
Visual web development tools

SublimeText3 Mac version
God-level code editing software (SublimeText3)
Hot Topics
 1653
1653
 14
1413
52
1304
25
1251
29
1224
24
14
1413
52
1304
25
1251
29
1224
24

 What should I do if I encounter garbled code printing for front-end thermal paper receipts?
Apr 04, 2025 pm 02:42 PM
What should I do if I encounter garbled code printing for front-end thermal paper receipts?
Apr 04, 2025 pm 02:42 PM
Frequently Asked Questions and Solutions for Front-end Thermal Paper Ticket Printing In Front-end Development, Ticket Printing is a common requirement. However, many developers are implementing...
 Demystifying JavaScript: What It Does and Why It Matters
Apr 09, 2025 am 12:07 AM
Demystifying JavaScript: What It Does and Why It Matters
Apr 09, 2025 am 12:07 AM
JavaScript is the cornerstone of modern web development, and its main functions include event-driven programming, dynamic content generation and asynchronous programming. 1) Event-driven programming allows web pages to change dynamically according to user operations. 2) Dynamic content generation allows page content to be adjusted according to conditions. 3) Asynchronous programming ensures that the user interface is not blocked. JavaScript is widely used in web interaction, single-page application and server-side development, greatly improving the flexibility of user experience and cross-platform development.
 Who gets paid more Python or JavaScript?
Apr 04, 2025 am 12:09 AM
Who gets paid more Python or JavaScript?
Apr 04, 2025 am 12:09 AM
There is no absolute salary for Python and JavaScript developers, depending on skills and industry needs. 1. Python may be paid more in data science and machine learning. 2. JavaScript has great demand in front-end and full-stack development, and its salary is also considerable. 3. Influencing factors include experience, geographical location, company size and specific skills.
 How to achieve parallax scrolling and element animation effects, like Shiseido's official website?
or:
How can we achieve the animation effect accompanied by page scrolling like Shiseido's official website?
Apr 04, 2025 pm 05:36 PM
How to achieve parallax scrolling and element animation effects, like Shiseido's official website?
or:
How can we achieve the animation effect accompanied by page scrolling like Shiseido's official website?
Apr 04, 2025 pm 05:36 PM
Discussion on the realization of parallax scrolling and element animation effects in this article will explore how to achieve similar to Shiseido official website (https://www.shiseido.co.jp/sb/wonderland/)...
 Is JavaScript hard to learn?
Apr 03, 2025 am 12:20 AM
Is JavaScript hard to learn?
Apr 03, 2025 am 12:20 AM
Learning JavaScript is not difficult, but it is challenging. 1) Understand basic concepts such as variables, data types, functions, etc. 2) Master asynchronous programming and implement it through event loops. 3) Use DOM operations and Promise to handle asynchronous requests. 4) Avoid common mistakes and use debugging techniques. 5) Optimize performance and follow best practices.
 The Evolution of JavaScript: Current Trends and Future Prospects
Apr 10, 2025 am 09:33 AM
The Evolution of JavaScript: Current Trends and Future Prospects
Apr 10, 2025 am 09:33 AM
The latest trends in JavaScript include the rise of TypeScript, the popularity of modern frameworks and libraries, and the application of WebAssembly. Future prospects cover more powerful type systems, the development of server-side JavaScript, the expansion of artificial intelligence and machine learning, and the potential of IoT and edge computing.
 How to merge array elements with the same ID into one object using JavaScript?
Apr 04, 2025 pm 05:09 PM
How to merge array elements with the same ID into one object using JavaScript?
Apr 04, 2025 pm 05:09 PM
How to merge array elements with the same ID into one object in JavaScript? When processing data, we often encounter the need to have the same ID...
 How to implement panel drag and drop adjustment function similar to VSCode in front-end development?
Apr 04, 2025 pm 02:06 PM
How to implement panel drag and drop adjustment function similar to VSCode in front-end development?
Apr 04, 2025 pm 02:06 PM
Explore the implementation of panel drag and drop adjustment function similar to VSCode in the front-end. In front-end development, how to implement VSCode similar to VSCode...
