 Web Front-end
 JS Tutorial
 How to use NodeJS + Lighthouse + Gulp to build an automated website performance testing tool
How to use NodeJS + Lighthouse + Gulp to build an automated website performance testing tool
This article mainly introduces how to use NodeJS Lighthouse Gulp to build automated website performance testing tools. It has a certain reference value. Now I share it with you. Friends in need can refer to it.
Assuming you still I don’t know what Lighthouse is
Lighthouse is an open source tool owned by Google that can automatically detect website quality. It has a friendly interface, simple operation, diverse usage methods, and comprehensive perspectives. You can use it to test any web page. Normally Users, QA, and developers can all get started quickly.
Startup posture
Difficulty level 1
There are many ways to use Lighthouse. The simplest one is to use Chrome's developer tools. The steps are as follows:
Open Chrome browser
Press F12
-
Open the audits tab in the pop-up window
Click Perform an audit...check all
Run audit
- Install Node
- Install Lighthouse
npm install -g lighthouse
- run in the command line
lighthouse
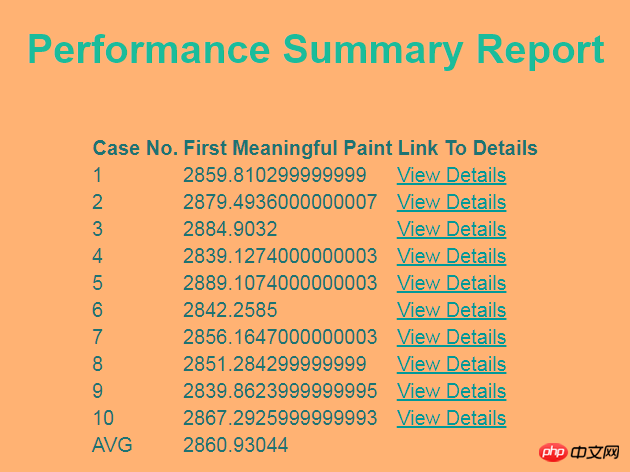
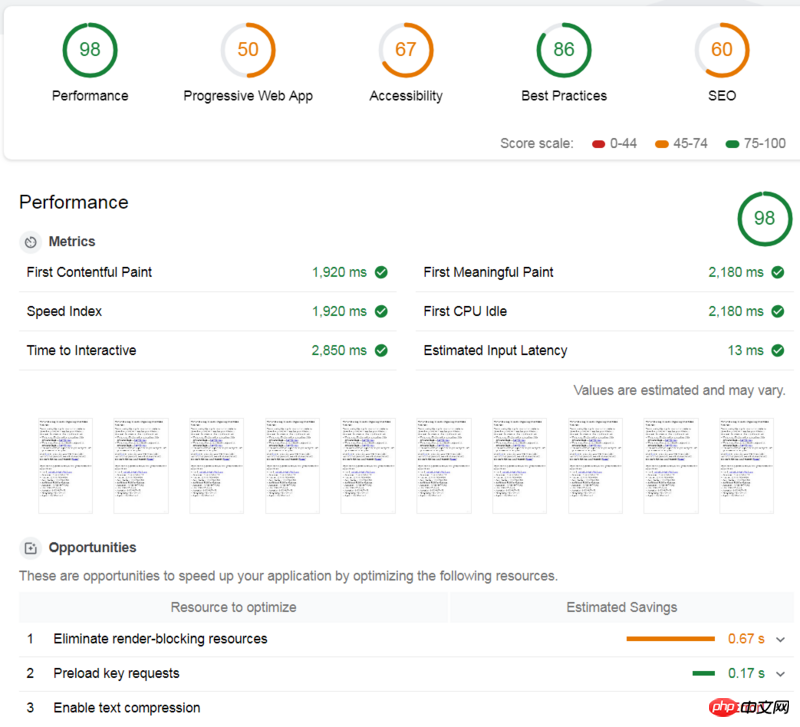
first-meaningful-paint milliseconds in the result indicator, and finally take the average of 10 times. For the sake of visualization and readability, the final results are displayed in the form of a web page, and users can view it on the web page. You can also see the average number of milliseconds to first-meaningful-paint after each execution of Lighthouse. If the user is interested in the details of a certain execution, he can click on the link to view it. The final result looks like this:
npm i lighthouse --save-dev
npm i chrome-launcher --save-dev
npm i fs-extra --save-dev
npm i gulp --save-dev
lighthouse-config.js in the project root directory. Here we all use the default configuration. To use the default configuration, you need to configure The file declares extends: 'lighthouse:default'.
module.exports = {
    extends: 'lighthouse:default'
}- Lighthouse Most of this article is about the command line, and command line parameters can also be used Node
- throttlingThis article is about network simulation
- Default Config Specific default configuration parameters
- Web Page Test simulates different network speeds
- Emulation simulates different devices
gulpfile.js, first introduce all dependent tools:
const gulp = require('gulp');
const lighthouse = require('lighthouse');
const chromeLauncher = require('chrome-launcher');
const printer = require('lighthouse/lighthouse-cli/printer');
const Reporter = require('lighthouse/lighthouse-core/report/report-generator');
const fs = require('fs-extra');
const config = require('.lighthouse-config.js');async function write(file, report) {
try {
await fs.outputFile(file, report);
} catch (Error e) {
console.log("error while writing report ", e);
}
}--headless means not opening the browser window.
async function launchChrome() {
    let chrome;
    try {
        chrome =  await chromeLauncher.launch({
          chromeFlags: [
            "--disable-gpu",
            "--no-sandbox",
            "--headless"
          ],
          enableExtensions: true,
          logLevel: "error"
        });
        console.log(chrome.port)
        return {
            port: chrome.port,
            chromeFlags: [
                "--headless"
            ],
            logLevel: "error"
         }
    } catch (e) {
        console.log("Error while launching Chrome ", e);
    }
}async function lighthouseRunner(opt) {
try {
return await lighthouse("https://www.baidu.com", opt, config);
} catch (e) {
console.log("Error while running lighthouse");
}
}Since we need to use the official Lighthouse template to generate the report, we call the official method. Note that the first parameter is passed in
result.lhr, and the second parameter is declared to generate an html report (you can also Generate reports in csv and other formats).
function genReport(result) {
    return Reporter.generateReport(result.lhr, 'html');
}start method returns first-meaningful-paint in the result (this is the indicator we are most concerned about. Readers can replace it according to their own needs. For specific indicators, please refer to Lighthouse).
async function run(timestamp, num) {
    let chromeOpt = await launchChrome();
    let result = await lighthouseRunner(chromeOpt);
    let report = genReport(result);
    await printer.write(report, 'html', `./cases/lighthouse-report@${timestamp}-${num}.html`);
    return result.lhr.audits['first-meaningful-paint'].rawValue;
    await chrome.kill();
}下面, 我们可以正式开始写一个 gulp task 啦,首先获得当前时间戳,用于最终生成的报告命名,然后声明一个数组,用于记录每次跑 Lighthouse 生成的 first-meaningful-paint 毫秒数,然后跑10次 Lighthouse, 使用提前创建的模板文件,根据这10的结果,生成一个汇总报告,这里,笔者使用了Lighthouse对外暴露的工具函数进行字符串的替换。
gulp.task('start', async function() {
  let timestamp = Date.now();
  let spent = [];
for(let i=0; i<p>最后的最后, 执行:</p><pre class="brush:php;toolbar:false">gulp start万事大吉。
附上汇总界面的模板源码:
nbsp;html>


  <meta>
  <meta>
  <title>Lighthouse Summary Report</title>
  <style>
    body {
      font-family: sans-serif;
    }
    table {
      margin: auto;
    }
    tr {
      border: 1px solid grey;
    }
    h1 {
       text-align: center;
       margin: 30px auto 50px auto
    }
  </style>
| Case No. | First Meaningful Paint | Link To Details |
|---|
以上就是本文的全部内容,希望对大家的学习有所帮助,更多相关内容请关注PHP中文网!
相关推荐:
jQuery+AJAX+PHP+MySQL开发搜索无跳转无刷新的功能
关于vue中extend,mixins,extends,components,install的操作
The above is the detailed content of How to use NodeJS + Lighthouse + Gulp to build an automated website performance testing tool. For more information, please follow other related articles on the PHP Chinese website!

Hot AI Tools

Undresser.AI Undress
AI-powered app for creating realistic nude photos

AI Clothes Remover
Online AI tool for removing clothes from photos.

Undress AI Tool
Undress images for free

Clothoff.io
AI clothes remover

Video Face Swap
Swap faces in any video effortlessly with our completely free AI face swap tool!

Hot Article

Hot Tools

Notepad++7.3.1
Easy-to-use and free code editor

SublimeText3 Chinese version
Chinese version, very easy to use

Zend Studio 13.0.1
Powerful PHP integrated development environment

Dreamweaver CS6
Visual web development tools

SublimeText3 Mac version
God-level code editing software (SublimeText3)

Hot Topics
 1672
1672
 14
14
 1428
1428
 52
52
 1332
1332
 25
25
 1277
1277
 29
29
 1257
1257
 24
24
 How to implement an online speech recognition system using WebSocket and JavaScript
Dec 17, 2023 pm 02:54 PM
How to use WebSocket and JavaScript to implement an online speech recognition system Introduction: With the continuous development of technology, speech recognition technology has become an important part of the field of artificial intelligence. The online speech recognition system based on WebSocket and JavaScript has the characteristics of low latency, real-time and cross-platform, and has become a widely used solution. This article will introduce how to use WebSocket and JavaScript to implement an online speech recognition system.
 WebSocket and JavaScript: key technologies for implementing real-time monitoring systems
Dec 17, 2023 pm 05:30 PM
WebSocket and JavaScript: Key technologies for realizing real-time monitoring systems Introduction: With the rapid development of Internet technology, real-time monitoring systems have been widely used in various fields. One of the key technologies to achieve real-time monitoring is the combination of WebSocket and JavaScript. This article will introduce the application of WebSocket and JavaScript in real-time monitoring systems, give code examples, and explain their implementation principles in detail. 1. WebSocket technology
 How to use JavaScript and WebSocket to implement a real-time online ordering system
Dec 17, 2023 pm 12:09 PM
Introduction to how to use JavaScript and WebSocket to implement a real-time online ordering system: With the popularity of the Internet and the advancement of technology, more and more restaurants have begun to provide online ordering services. In order to implement a real-time online ordering system, we can use JavaScript and WebSocket technology. WebSocket is a full-duplex communication protocol based on the TCP protocol, which can realize real-time two-way communication between the client and the server. In the real-time online ordering system, when the user selects dishes and places an order
 How to implement an online reservation system using WebSocket and JavaScript
Dec 17, 2023 am 09:39 AM
How to use WebSocket and JavaScript to implement an online reservation system. In today's digital era, more and more businesses and services need to provide online reservation functions. It is crucial to implement an efficient and real-time online reservation system. This article will introduce how to use WebSocket and JavaScript to implement an online reservation system, and provide specific code examples. 1. What is WebSocket? WebSocket is a full-duplex method on a single TCP connection.
 JavaScript and WebSocket: Building an efficient real-time weather forecasting system
Dec 17, 2023 pm 05:13 PM
JavaScript and WebSocket: Building an efficient real-time weather forecast system Introduction: Today, the accuracy of weather forecasts is of great significance to daily life and decision-making. As technology develops, we can provide more accurate and reliable weather forecasts by obtaining weather data in real time. In this article, we will learn how to use JavaScript and WebSocket technology to build an efficient real-time weather forecast system. This article will demonstrate the implementation process through specific code examples. We
 Simple JavaScript Tutorial: How to Get HTTP Status Code
Jan 05, 2024 pm 06:08 PM
JavaScript tutorial: How to get HTTP status code, specific code examples are required. Preface: In web development, data interaction with the server is often involved. When communicating with the server, we often need to obtain the returned HTTP status code to determine whether the operation is successful, and perform corresponding processing based on different status codes. This article will teach you how to use JavaScript to obtain HTTP status codes and provide some practical code examples. Using XMLHttpRequest
 How to use insertBefore in javascript
Nov 24, 2023 am 11:56 AM
Usage: In JavaScript, the insertBefore() method is used to insert a new node in the DOM tree. This method requires two parameters: the new node to be inserted and the reference node (that is, the node where the new node will be inserted).
 How to get HTTP status code in JavaScript the easy way
Jan 05, 2024 pm 01:37 PM
Introduction to the method of obtaining HTTP status code in JavaScript: In front-end development, we often need to deal with the interaction with the back-end interface, and HTTP status code is a very important part of it. Understanding and obtaining HTTP status codes helps us better handle the data returned by the interface. This article will introduce how to use JavaScript to obtain HTTP status codes and provide specific code examples. 1. What is HTTP status code? HTTP status code means that when the browser initiates a request to the server, the service


