
 Web Front-end
JS Tutorial
js implements the code of the floating ad bar that can be closed at the top of the website
Web Front-end
JS Tutorial
js implements the code of the floating ad bar that can be closed at the top of the website
js implements the code of the floating ad bar that can be closed at the top of the website

This article mainly introduces the js implementation of the floating ad bar code that can be closed at the top of the website, involving the implementation techniques of javascript based on mouse events to operate page element styles. Friends in need can refer to the following
This article explains the examples Use js to realize the closing floating advertising banner at the top of the website. Share it with everyone for your reference. The details are as follows:
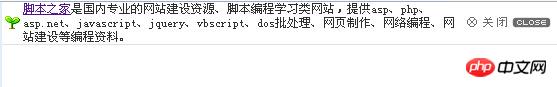
This is an advertising banner code that usually floats at the top of the website and can be closed. The design is beautiful and simple, with a close button, adaptive to the width of the web page, and clear colors. I believe many friends will like it. .
The screenshot of the running effect is as follows:
The online demo address is as follows:
http://demo.jb51. net/js/2015/js-top-float-clase-able-adv-codes/
The specific code is as follows:
<html>
<head>
<title>网站页首可关闭广告条</title>
<style type="text/css">
<!--
body { margin: 0px;padding: 0px;text-align: center;}
TD {FONT-SIZE: 12px; COLOR: #333;}
#topadv {BORDER-BOTTOM: #e2e2e2 1px solid;}
-->
</style>
</head>
<body>
<SCRIPT>
 function floatadv(){
  document.getElementById("topadv").style.display="none";
 }
</SCRIPT>
<p id=topadv>
<table width="100%" border="0" cellspacing="0" cellpadding="0">
 <tr>
 <td width="4%" height="30" align="center"><img src="images/kids.gif" width="15" height="14"></td>
 <td width="82%"><a href="//www.jb51.net/">脚本之家</a>是国内专业的网站建设资源、脚本编程学习类网站,提供asp、php、asp.net、javascript、jquery、vbscript、dos批处理、网页制作、网络编程、网站建设等编程资料。</td>
 <td width="14%" align="right"><a style="CURSOR: hand" onClick=floatadv()><img
 src="images/close.gif" width=84 height=11 hspace="6" border=0></a></td>
 </tr>
</table>
</p>
</body>
</html>The above is the entire content of this chapter, more For more related tutorials, please visit JavaScript Video Tutorial!

Hot AI Tools

Undresser.AI Undress
AI-powered app for creating realistic nude photos

AI Clothes Remover
Online AI tool for removing clothes from photos.

Undress AI Tool
Undress images for free

Clothoff.io
AI clothes remover

AI Hentai Generator
Generate AI Hentai for free.

Hot Article
Hot Tools

Notepad++7.3.1
Easy-to-use and free code editor

SublimeText3 Chinese version
Chinese version, very easy to use

Zend Studio 13.0.1
Powerful PHP integrated development environment

Dreamweaver CS6
Visual web development tools

SublimeText3 Mac version
God-level code editing software (SublimeText3)
Hot Topics
 1379
1379
 52
52

 How to use JS and Baidu Maps to implement map pan function
Nov 21, 2023 am 10:00 AM
How to use JS and Baidu Maps to implement map pan function
Nov 21, 2023 am 10:00 AM
How to use JS and Baidu Map to implement map pan function Baidu Map is a widely used map service platform, which is often used in web development to display geographical information, positioning and other functions. This article will introduce how to use JS and Baidu Map API to implement the map pan function, and provide specific code examples. 1. Preparation Before using Baidu Map API, you first need to apply for a developer account on Baidu Map Open Platform (http://lbsyun.baidu.com/) and create an application. Creation completed
 Recommended: Excellent JS open source face detection and recognition project
Apr 03, 2024 am 11:55 AM
Recommended: Excellent JS open source face detection and recognition project
Apr 03, 2024 am 11:55 AM
Face detection and recognition technology is already a relatively mature and widely used technology. Currently, the most widely used Internet application language is JS. Implementing face detection and recognition on the Web front-end has advantages and disadvantages compared to back-end face recognition. Advantages include reducing network interaction and real-time recognition, which greatly shortens user waiting time and improves user experience; disadvantages include: being limited by model size, the accuracy is also limited. How to use js to implement face detection on the web? In order to implement face recognition on the Web, you need to be familiar with related programming languages and technologies, such as JavaScript, HTML, CSS, WebRTC, etc. At the same time, you also need to master relevant computer vision and artificial intelligence technologies. It is worth noting that due to the design of the Web side
 Essential tools for stock analysis: Learn the steps to draw candle charts with PHP and JS
Dec 17, 2023 pm 06:55 PM
Essential tools for stock analysis: Learn the steps to draw candle charts with PHP and JS
Dec 17, 2023 pm 06:55 PM
Essential tools for stock analysis: Learn the steps to draw candle charts in PHP and JS. Specific code examples are required. With the rapid development of the Internet and technology, stock trading has become one of the important ways for many investors. Stock analysis is an important part of investor decision-making, and candle charts are widely used in technical analysis. Learning how to draw candle charts using PHP and JS will provide investors with more intuitive information to help them make better decisions. A candlestick chart is a technical chart that displays stock prices in the form of candlesticks. It shows the stock price
 How to create a stock candlestick chart using PHP and JS
Dec 17, 2023 am 08:08 AM
How to create a stock candlestick chart using PHP and JS
Dec 17, 2023 am 08:08 AM
How to use PHP and JS to create a stock candle chart. A stock candle chart is a common technical analysis graphic in the stock market. It helps investors understand stocks more intuitively by drawing data such as the opening price, closing price, highest price and lowest price of the stock. price fluctuations. This article will teach you how to create stock candle charts using PHP and JS, with specific code examples. 1. Preparation Before starting, we need to prepare the following environment: 1. A server running PHP 2. A browser that supports HTML5 and Canvas 3
 How to use JS and Baidu Maps to implement map heat map function
Nov 21, 2023 am 09:33 AM
How to use JS and Baidu Maps to implement map heat map function
Nov 21, 2023 am 09:33 AM
How to use JS and Baidu Maps to implement the map heat map function Introduction: With the rapid development of the Internet and mobile devices, maps have become a common application scenario. As a visual display method, heat maps can help us understand the distribution of data more intuitively. This article will introduce how to use JS and Baidu Map API to implement the map heat map function, and provide specific code examples. Preparation work: Before starting, you need to prepare the following items: a Baidu developer account, create an application, and obtain the corresponding AP
 How to use JS and Baidu Map to implement map click event processing function
Nov 21, 2023 am 11:11 AM
How to use JS and Baidu Map to implement map click event processing function
Nov 21, 2023 am 11:11 AM
Overview of how to use JS and Baidu Maps to implement map click event processing: In web development, it is often necessary to use map functions to display geographical location and geographical information. Click event processing on the map is a commonly used and important part of the map function. This article will introduce how to use JS and Baidu Map API to implement the click event processing function of the map, and give specific code examples. Steps: Import the API file of Baidu Map. First, import the file of Baidu Map API in the HTML file. This can be achieved through the following code:
 PHP and JS Development Tips: Master the Method of Drawing Stock Candle Charts
Dec 18, 2023 pm 03:39 PM
PHP and JS Development Tips: Master the Method of Drawing Stock Candle Charts
Dec 18, 2023 pm 03:39 PM
With the rapid development of Internet finance, stock investment has become the choice of more and more people. In stock trading, candle charts are a commonly used technical analysis method. It can show the changing trend of stock prices and help investors make more accurate decisions. This article will introduce the development skills of PHP and JS, lead readers to understand how to draw stock candle charts, and provide specific code examples. 1. Understanding Stock Candle Charts Before introducing how to draw stock candle charts, we first need to understand what a candle chart is. Candlestick charts were developed by the Japanese
 How to use JS and Baidu Maps to implement map polygon drawing function
Nov 21, 2023 am 10:53 AM
How to use JS and Baidu Maps to implement map polygon drawing function
Nov 21, 2023 am 10:53 AM
How to use JS and Baidu Maps to implement map polygon drawing function. In modern web development, map applications have become one of the common functions. Drawing polygons on the map can help us mark specific areas for users to view and analyze. This article will introduce how to use JS and Baidu Map API to implement map polygon drawing function, and provide specific code examples. First, we need to introduce Baidu Map API. You can use the following code to import the JavaScript of Baidu Map API in an HTML file
