1. Story
Perhaps you are often asked about the monthly data volume growth of a certain table in the library in the past year. Of course, if you have tables divided by month, it is easier to handle. show table status one by one. If there is only one big table, then you probably have to run SQL statistics in the lonely night when everyone is resting, because you Only the current table information can be obtained, and historical information cannot be traced.
In addition, as a DBA, you must also estimate the growth of database space to plan capacity. The table information we are talking about mainly includes:
Table data size (DATA_LENGTH)
Index size (INDEX_LENGTH)
Number of rows (ROWS)
Current auto-increment value (AUTO_INCREMENT, if any)
I haven’t seen which one yetmysqlMonitoring tools provide such indicators. This information does not need to be collected too frequently, and the result is only an estimate and may not be accurate, so this is to monitor (collect) the table from a global and long-term perspective.
The collection tool I wrote to introduce in this article is based on the existing monitoring system in the group:
InfluxDB: Time series Database, stores monitoring data
Grafana: Data display panel
Telegraf: Collect information The agent
took a look at the latest mysql plug-in of telegraf. I was very pleased at first: it supports the collection of Table schema statistics and Info schema auto increment columns. I tried it out and there is data, but as mentioned before, except for the self-increased value, everything else is an estimate. It is meaningless if telegraf collects too frequently. Maybe 2 times a day is enough. The IntervalSlow## it provides #The option is hard-coded and can only slow down the frequency of global status monitoring. However, it can be implemented by separating it from other monitoring indicators into two configuration files and defining the collection intervals respectively.
Finally I plan to use python to build one myself and report it to influxdb:)
2. Concept
For the complete code, see the GitHub project address: DBschema_gather
The implementation is also very simple, just query the
COLUMNS and TABLES two tables of the information_schema library:
SELECT
    IFNULL(@@hostname, @@server_id) SERVER_NAME,
    %s as HOST,
    t.TABLE_SCHEMA,
    t.TABLE_NAME,
    t.TABLE_ROWS,
    t.DATA_LENGTH,
    t.INDEX_LENGTH,
    t.AUTO_INCREMENT,
  c.COLUMN_NAME,
  c.DATA_TYPE,
  LOCATE('unsigned', c.COLUMN_TYPE) COL_UNSIGNED
  # CONCAT(c.DATA_TYPE, IF(LOCATE('unsigned', c.COLUMN_TYPE)=0, '', '_unsigned'))
FROM
    information_schema.`TABLES` t
LEFT JOIN information_schema.`COLUMNS` c ON t.TABLE_SCHEMA = c.TABLE_SCHEMA
AND t.TABLE_NAME = c.TABLE_NAME
AND c.EXTRA = 'auto_increment'
WHERE
    t.TABLE_SCHEMA NOT IN (
        'mysql',
        'information_schema',
        'performance_schema',
        'sys'
    )
AND t.TABLE_TYPE = 'BASE TABLE'
Copy after login
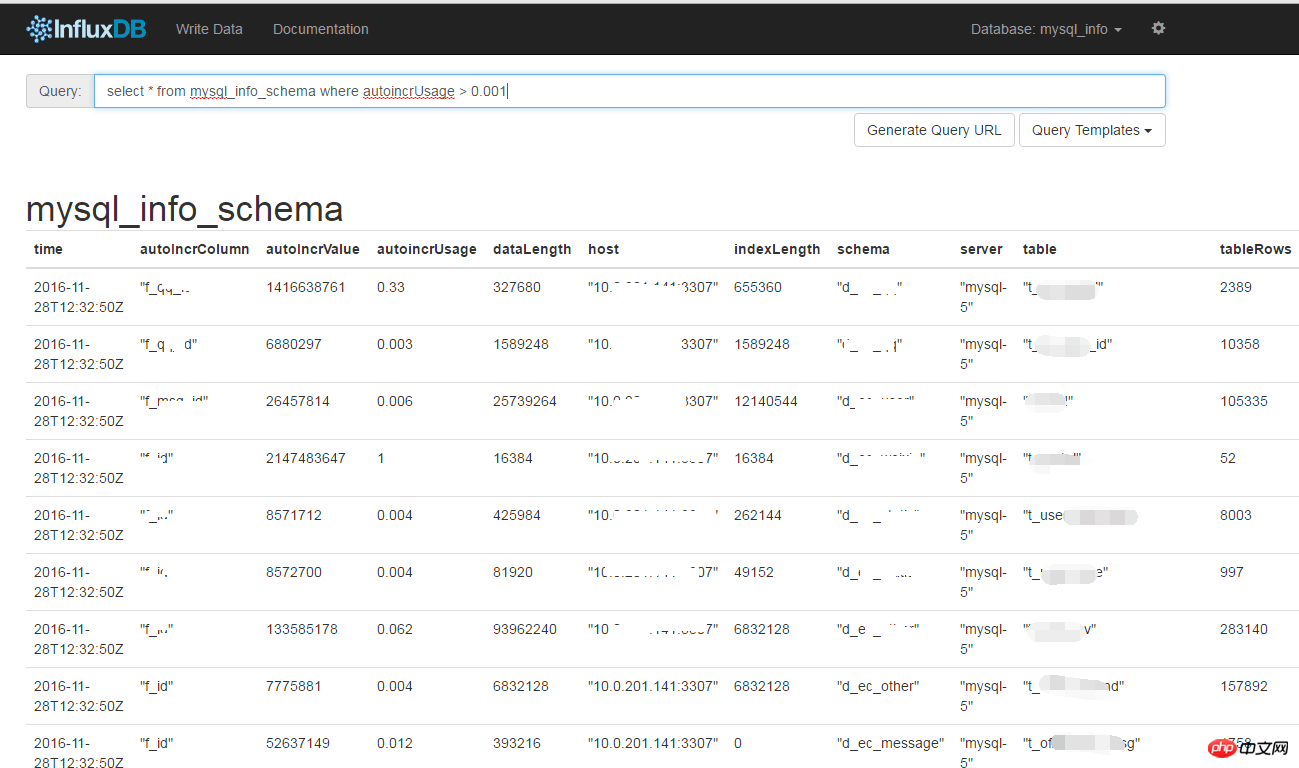
Regarding
auto_increment, in addition to paying attention to where the current growth is, we also care about how much free space is compared to the maximum value of int / bigint. So the autoIncrUsage column was calculated to save the currently used ratio.
Then use the python client of InfluxDB to store influxdb in batches. Without InfluxDB, the result will print out
json - this is a format commonly supported by monitoring tools such as Zabbix and Open-Falcon.
The last step is to use Grafana to draw pictures from the influxdb data source.
3. Usage
- Environment
Written in python 2.7 environment, 2.6 and 3.x have not been tested.
Operation requires two libraries:
MySQLdb and influxdb:
$ sudo pip install mysql-python influxdb
Copy after login
- Configuration
settings_dbs.py Configuration file
- ##DBLIST_INFO
: List Store the MySQL instance table information that needs to be collected. The tuples are the connection address, port, user name, and password. Users need the permission to select the table, otherwise they cannot see the corresponding information.
- InfluxDB_INFO
: Influxdb connection information, please create the database name in advance mysql_info is set to None
The output result is json.
Create the database and storage strategy on influxdb- Storage for 2 years, 1 replica set: (Adjust as needed)
CREATE DATABASE "mysql_info"
CREATE RETENTION POLICY "mysql_info_schema" ON "mysql_info" DURATION 730d REPLICATION 1 DEFAULT
Copy after login
Put crontab to run- It can be placed separately on the server used for monitoring, but it is recommended to be used in production The environment can be run on the host where the mysql instance is located, for safety reasons.
General libraries will have data migration actions at night. You can run
mysql_schema_info.py before and after migration to collect it. Not recommended too often. <div class="code" style="position:relative; padding:0px; margin:0px;"><pre class="brush:sql;toolbar:false;">40 23,5,12,18 * * * /opt/DBschema_info/mysql_schema_info.py >> /tmp/collect_DBschema_info.log 2>&1</pre><div class="contentsignin">Copy after login</div></div>
Table data size and number of rows
##Increment in the number of rows per day, auto_increment usage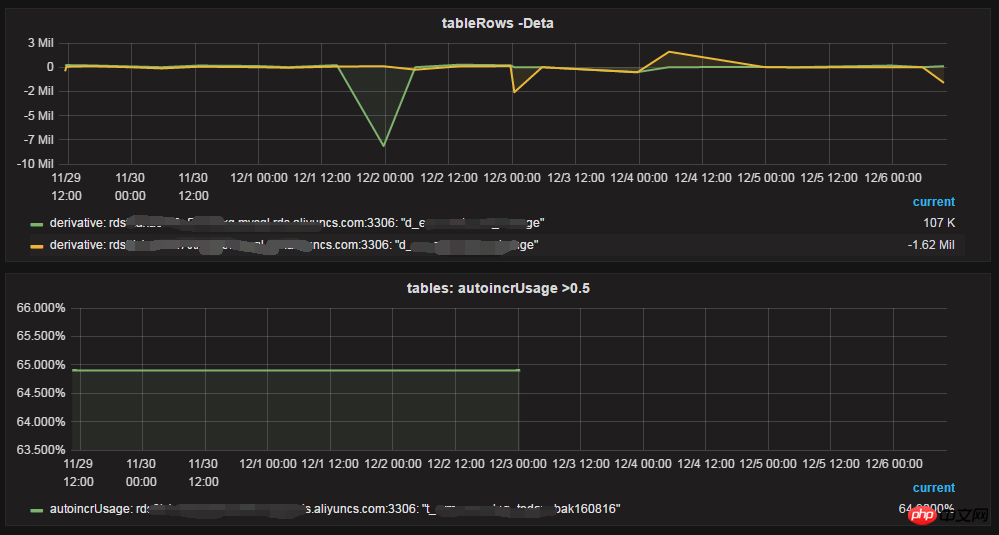
4. More
In the case of sub-database and table, the global unique ID cannot be calculated in the table autoIncrUsage
It is actually very difficult to implement Simple, the more important thing is to awaken the awareness of collecting this information
You can add Graphite output format
The above is the detailed content of Detailed explanation of the code for collecting table information while monitoring MySQL (pictures and text). For more information, please follow other related articles on the PHP Chinese website!


![[Web front-end] Node.js quick start](https://img.php.cn/upload/course/000/000/067/662b5d34ba7c0227.png)


