 Backend Development
 PHP Tutorial
 Xdebug+ZendStudio configuration zend studio 13 debug Android studio debug debugging zend studio 10 debu
Xdebug+ZendStudio configuration zend studio 13 debug Android studio debug debugging zend studio 10 debu
Original link: http://www.orlion.ga/689/
I have known about such a thing for a long time, but it has never been used. I have been using exit() and var_dump() debugging, which is very inefficient.
First download the xdebug dll file (under Window environment) at: https://xdebug.org/download.php. This time, the download is php_xdebug-2.3.3-5.5-vc11-x86_64.dll. (This is a thread-safe version) After downloading, place it in the ext folder of the PHP installation directory. Then configure php.ini and add these lines:
XDEBUG Extension

zend_extension="C:\wamp\bin\php\php5.5.12\ext\php_xdebug-2.3.3-5.5-vc11-x86_64.dll"
;允许远程IDE调试
xdebug.remote_enable=true
;远程主机
xdebug.remote_host=127.0.0.1

xdebug.profiler_enable=on
;临时跟踪信息输出
;xdebug.trace_output_dir="C:\wamp\xdebug\trace"
;xdebug.profiler_output_dir="C:\wamp\xdebug\profiler"

xdebug.auto_trace=On
;开启异常跟踪
xdebug.show_excepti
;开启远程调试自动启动
xdebug.remote_autostart=On
;收集变量
xdebug.collect_vars=On
;收集返回值
xdebug.collect_return=On
;收集参数
xdebug.collect_params=On
;显示局部变量
xdebug.show_local_vars=On
;显示默认的错误信息
xdebug.default_enable=On
;用于zend studio远程调试的应用层通信协议
xdebug.remote_handler=dbgp
;如果设得太小,函数中有递归调用自身次数太多时会报超过最大嵌套数错
xdebug.max_nesting_level=10000
You can refer to: http://www.cnblogs.com/dreamhome/p/3218744.html, http://blog.csdn.net/xinzheng_wang/article/details + gt; Preferences->PHP->Debug:
-
Then you can create a file and add breakpoints, and then right-click the file- >Debug as->PHP CLI Application.
-
The above introduces the Xdebug+ZendStudio configuration, including studio and debug content. I hope it will be helpful to friends who are interested in PHP tutorials.

- The PHP Server:wamp_apache in the above picture was configured before. It is best to configure one

Hot AI Tools

Undresser.AI Undress
AI-powered app for creating realistic nude photos

AI Clothes Remover
Online AI tool for removing clothes from photos.

Undress AI Tool
Undress images for free

Clothoff.io
AI clothes remover

Video Face Swap
Swap faces in any video effortlessly with our completely free AI face swap tool!

Hot Article

Hot Tools

Notepad++7.3.1
Easy-to-use and free code editor

SublimeText3 Chinese version
Chinese version, very easy to use

Zend Studio 13.0.1
Powerful PHP integrated development environment

Dreamweaver CS6
Visual web development tools

SublimeText3 Mac version
God-level code editing software (SublimeText3)

Hot Topics
 1666
1666
 14
14
 1426
1426
 52
52
 1328
1328
 25
25
 1273
1273
 29
29
 1255
1255
 24
24
 How to solve the problem of invalid debugging when setting breakpoints in SpringBoot project
May 11, 2023 am 10:49 AM
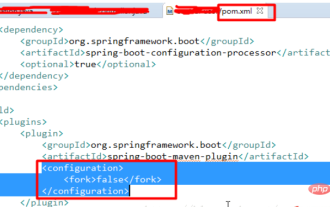
I am new to the springboot project. (1) I found that breakpoint debugging was ineffective. I was very depressed and searched for solutions online. All I saw were some very complicated solutions, which were said to be remote debugging, but also required additional opening slogans. This is different from a traditional project, so I don’t think it’s necessary. So after some exploration, I found that there is a simpler way. The steps are as follows: Add a configuration in the plugin part of the pom file: false and it will be ok; (2) Regarding the error in the SpringBoot project that the web.xml file is missing, because Traditional web projects require web.xml files, but SpringBoot projects do not require web.xml files.
 How does android studio upload pictures to java server
Apr 28, 2023 pm 09:07 PM
1.build.gradle configuration (increase) dependencies{implementation'com.squareup.okhttp3:okhttp:4.9.0'implementation'org.conscrypt:conscrypt-android:2.5.1'} 2.AndroidManifest.xml configures permissions in the application Add android:usesCleartextTraffic="true&q
 How to solve the problem that Android Studio cannot execute the main method of Java class
May 17, 2023 pm 04:43 PM
Environment androidstudio version: 3.6.1 gradle version: 5.6.4 gradle plug-in version: 3.6.1 Error prompt 11:41:35PM: Executingtask'TxtUtil.main()'...Executingtasks:[TxtUtil.main()]inproject/Users/ tinytongtong/Documents/workspace/as/self/BlogDemoFAILURE:Buildfailedwithanexception.*Wh
 Windows 11 Academy: How to enable the Windows Studio Effects button in the 22635.3276 Preview system tray
Mar 07, 2024 am 08:10 AM
According to the news, Windows enthusiast @PhantomOfEarth recently tweeted that in the Beta channel Windows 11 Build 22635.3276 preview update, Microsoft has hidden a new feature: allowing users to enable the Windows Studio Effects button in the system tray area. Windows Studio Effects is a video experience enhancement tool that leverages machine learning algorithms. It uses a neural processing unit (NPU) to apply specific filters and effects to the user's camera and microphone to improve the appearance and sound quality of video calls. WindowsStudioEffects have 4 main uses, 3 for
 Take you to debug Nestjs project in VSCode (tutorial)
Apr 24, 2023 pm 05:53 PM
Friends who have used Vscode to write projects such as Node all know that if we want to troubleshoot a problem, we mostly print it through console.log to see where the problem is. If the problem involved is more complex, we will choose Through Vscode...
 UCIe 2.0: Advancing the open chiplet ecosystem with 3D packaging and manageability
Aug 08, 2024 pm 12:51 PM
The Universal Chiplet Interconnect Express (UCIe) Consortium has announced the release of the UCIe 2.0 specification, further advancing the open chiplet ecosystem. The latest specification introduces several key enhancements. First, it adds support f
 How to use IDEA remote connection Debug in springboot
May 10, 2023 pm 11:55 PM
1. First create a Demo ready for remote debugging. Pay attention to the configuration of the build project 4.0.0org.springframework.bootspring-boot-starter-parent2.1.4.RELEASEcom.remote.testremote_test0.0.1-SNAPSHOTremote_testDemoprojectforSpringBoot1.8org.springframework.bootspring-boot- starterorg.springframework.bootspring-bo
 How to effectively deal with overflow problems
Jan 27, 2024 am 09:39 AM
How to Correctly Deal with Overflow Problems Overflow is a common computer programming problem, especially when dealing with numbers or arrays. Overflow occurs when we try to store a value that exceeds the allowed range of the data type. The key to solving this problem lies in correctly handling and validating data boundaries. Several common overflow problems and corresponding solutions will be introduced below. Integer overflow Integer overflow means that during calculation, the result exceeds the representation range of the integer type. For example, in the 32-bit signed integer type in


