Detailed explanation of using Apache's ab tool example
ab command principle
Apache's ab command simulates multi-threaded concurrent requests to test server load pressure. It can also test the pressure of other web servers such as nginx, lighthttp, IIS, etc.
The ab tool that comes with Apache (the PHP environment used is the WAMP integrated environment, the ab tool is located in D:\wamp\bin\apache\Apache2.2.21\bin) is very easy to use. The ab command has very low requirements on the computer that issues the load. It will not occupy a lot of CPU or memory, but it will cause a huge load to the target server. Therefore, it is a necessary medicine for some DDOS attacks. Suitable for all. You must also be careful when using it yourself. Otherwise, too much load is applied at once, causing the target server to crash due to running out of memory and having to hard restart, which is not worth the loss.
In the case of insufficient bandwidth, it is best to test on the local machine. It is recommended to use another or multiple servers on the intranet to test through the intranet. The data obtained in this way will be much more accurate. . Remote stress testing of web servers often yields unsatisfactory results (due to excessive network latency or insufficient bandwidth)
Download and install:
;O=A
Find httpd- 2.2.21-win32-x86-no_ssl.msi
Parameter documentation:
Run:
Under Windows system, open the cmd command line window and navigate to the bin directory of the apache installation directory
cd C:\Program Files (x86)\Apache Software Foundation\Apache2.2\bin
Type the command:
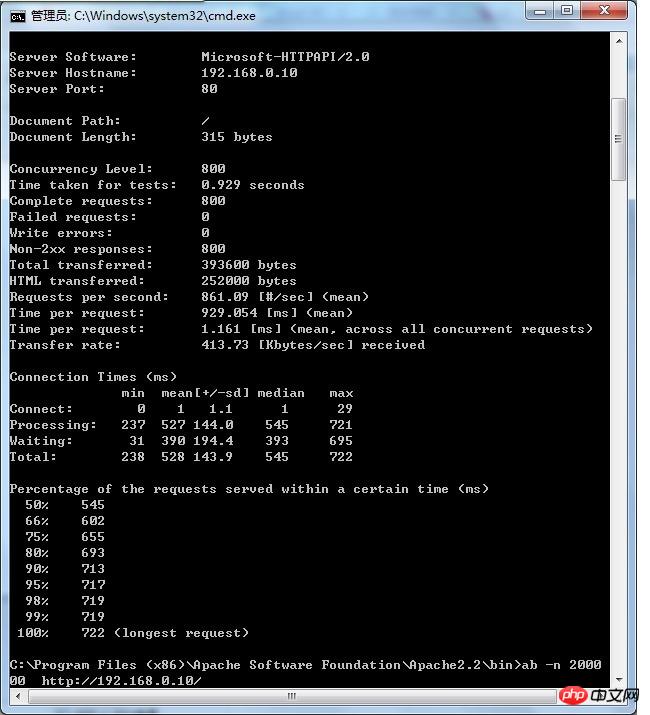
ab -n 800 -c 800 http://192.168.0.10/
(-n issues 800 requests, -c simulates 800 concurrency, equivalent to 800 people accessing at the same time, followed by the test url)
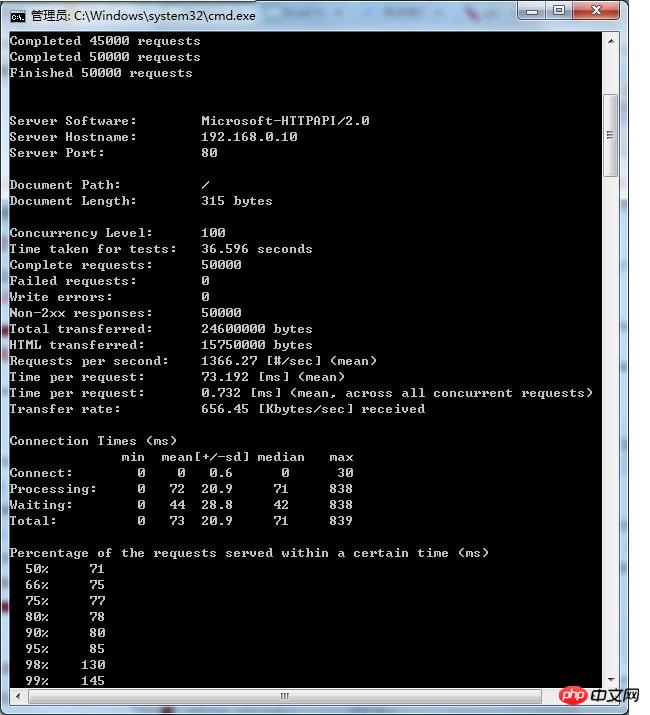
ab -t 60 -c 100 http://192.168.0.10/
Send requests within 60 seconds, 100 requests at a time.
//If you need to bring parameters in the url, do this
ab -t 60 -c 100 -T "text/plain" -p p.txt http://192.168.0.10/hello. html
p.txt is in the same directory as ab.exe
p.txt. You can write parameters in it, such as p=wdp&fq=78


Explanation of result parameters:
This is ApacheBench, Version 2.3
Copyright 1996 Adam Twiss, Zeus Technology Ltd,
Licenseed to The Apache Software Foundation,
Benchmarking 192.168.0.10 (be patient)
Completed 100 requests
Completed 200 requests
Completed 300 requests
Completed 400 requests
Completed 500 requests
Completed 600 requests
Completed 700 requests
Completed 800 requests
Finished 800 requests
Server Software: Microsoft-HTTPAPI/2.0 Represents the web server being tested Software name
Server Hostname: 192.168.0.10 Represents the requested URL host name
Server Port: 80 Represents the tested Web server software Listening port
Document Path: Root absolute path. Through the suffix name of this file, we can generally understand the type of the request
DOCUMENT LENGTH: 315 bytes.
Concurrency Level: 800 represents the number of concurrent users. This is one of the parameters we set. ## FAILED Requests: 0 Failure Requests
Write Errs: 0
Non-2xx Responses: 800
Total Transferred: 393600 bytes Total Transmission
HTML Transferred: 252000 bytes HTML content Transmission volume
Requests per second: 875.22 [#/sec] (mean) Throughput - number of requests per second
Time per request: 914.052 [ms] (mean) The time it takes for the server to receive a request and respond to the page
Time per request: 1.143 [ms] (mean, across all concurrent requests) The average time consumed by each concurrent request
Transfer rate: 420.52 [Kbytes/sec] received The average traffic on the network per second, which can help to rule out whether there is The problem of prolonged response time caused by excessive network traffic
Breakdown of time spent on the network:
Connect: 0 1 0.5 1 3
Processing: 245 534 125.2 570 682
Waiting: 11 386 189.1 409 669
Total: 246 535 125.0 571 684
Response status of all requests in the entire scenario. In the scenario, each request has a response time
50% of the user response time is less than 571 milliseconds
The maximum response time is less than 684 milliseconds
Percentage of the requests served within a certain time (ms)
50% 571
66% 627
75% 646
80% 652
90% 666
95% 677
98% 681
99% 682
100% 684 (longest request)
This part of the data is used to describe the distribution of each request processing time. For example, in the above test, 80% of the request processing time None exceed 6ms. This processing time refers to the previous Time per request, that is, the average processing time of each request for a single user.
The above is the detailed content of Detailed explanation of using Apache's ab tool example. For more information, please follow other related articles on the PHP Chinese website!

Hot AI Tools

Undresser.AI Undress
AI-powered app for creating realistic nude photos

AI Clothes Remover
Online AI tool for removing clothes from photos.

Undress AI Tool
Undress images for free

Clothoff.io
AI clothes remover

Video Face Swap
Swap faces in any video effortlessly with our completely free AI face swap tool!

Hot Article

Hot Tools

Notepad++7.3.1
Easy-to-use and free code editor

SublimeText3 Chinese version
Chinese version, very easy to use

Zend Studio 13.0.1
Powerful PHP integrated development environment

Dreamweaver CS6
Visual web development tools

SublimeText3 Mac version
God-level code editing software (SublimeText3)

Hot Topics
 1662
1662
 14
14
 1419
1419
 52
52
 1312
1312
 25
25
 1262
1262
 29
29
 1235
1235
 24
24
 How to set the cgi directory in apache
Apr 13, 2025 pm 01:18 PM
To set up a CGI directory in Apache, you need to perform the following steps: Create a CGI directory such as "cgi-bin", and grant Apache write permissions. Add the "ScriptAlias" directive block in the Apache configuration file to map the CGI directory to the "/cgi-bin" URL. Restart Apache.
 How to connect to the database of apache
Apr 13, 2025 pm 01:03 PM
Apache connects to a database requires the following steps: Install the database driver. Configure the web.xml file to create a connection pool. Create a JDBC data source and specify the connection settings. Use the JDBC API to access the database from Java code, including getting connections, creating statements, binding parameters, executing queries or updates, and processing results.
 How to view your apache version
Apr 13, 2025 pm 01:15 PM
There are 3 ways to view the version on the Apache server: via the command line (apachectl -v or apache2ctl -v), check the server status page (http://<server IP or domain name>/server-status), or view the Apache configuration file (ServerVersion: Apache/<version number>).
 What to do if the apache80 port is occupied
Apr 13, 2025 pm 01:24 PM
When the Apache 80 port is occupied, the solution is as follows: find out the process that occupies the port and close it. Check the firewall settings to make sure Apache is not blocked. If the above method does not work, please reconfigure Apache to use a different port. Restart the Apache service.
 How to view the apache version
Apr 13, 2025 pm 01:00 PM
How to view the Apache version? Start the Apache server: Use sudo service apache2 start to start the server. View version number: Use one of the following methods to view version: Command line: Run the apache2 -v command. Server Status Page: Access the default port of the Apache server (usually 80) in a web browser, and the version information is displayed at the bottom of the page.
 How to configure zend for apache
Apr 13, 2025 pm 12:57 PM
How to configure Zend in Apache? The steps to configure Zend Framework in an Apache Web Server are as follows: Install Zend Framework and extract it into the Web Server directory. Create a .htaccess file. Create the Zend application directory and add the index.php file. Configure the Zend application (application.ini). Restart the Apache Web server.
 How to solve the problem that apache cannot be started
Apr 13, 2025 pm 01:21 PM
Apache cannot start because the following reasons may be: Configuration file syntax error. Conflict with other application ports. Permissions issue. Out of memory. Process deadlock. Daemon failure. SELinux permissions issues. Firewall problem. Software conflict.
 How to delete more than server names of apache
Apr 13, 2025 pm 01:09 PM
To delete an extra ServerName directive from Apache, you can take the following steps: Identify and delete the extra ServerName directive. Restart Apache to make the changes take effect. Check the configuration file to verify changes. Test the server to make sure the problem is resolved.


