 Backend Development
 PHP Tutorial
 Graphical code tutorial on the installation and use of xhprof performance analysis tool under php7
Graphical code tutorial on the installation and use of xhprof performance analysis tool under php7
Install xhprof
cd xhprof/extension/
phpize
./configure
makemake install
Then add
extension=xhprof.so
execution
php -m | grep xhprof
to /etc/php.ini according to the situation and you can see Output, indicating that the php extension is installed successfully, and then restart Apache or php-fpm
Run
You can directly run the example in the example directory in the file cloned from github
The output is as follows
Array
(    [main()] => Array        (            [ct] => 1            [wt] => 9        ))
---------------Assuming you have set up the http based UI for
XHProf at some address, you can view run at
http://<xhprof-ui-address>/index.php?run=592567308784c&source=xhprof_foo
---------------
Then copy the ?run=592567308784c&source=xhprof_foo
Visit
xhprof_html/index.php?run=592567308784c&source=xhprof_foo
You can see the output
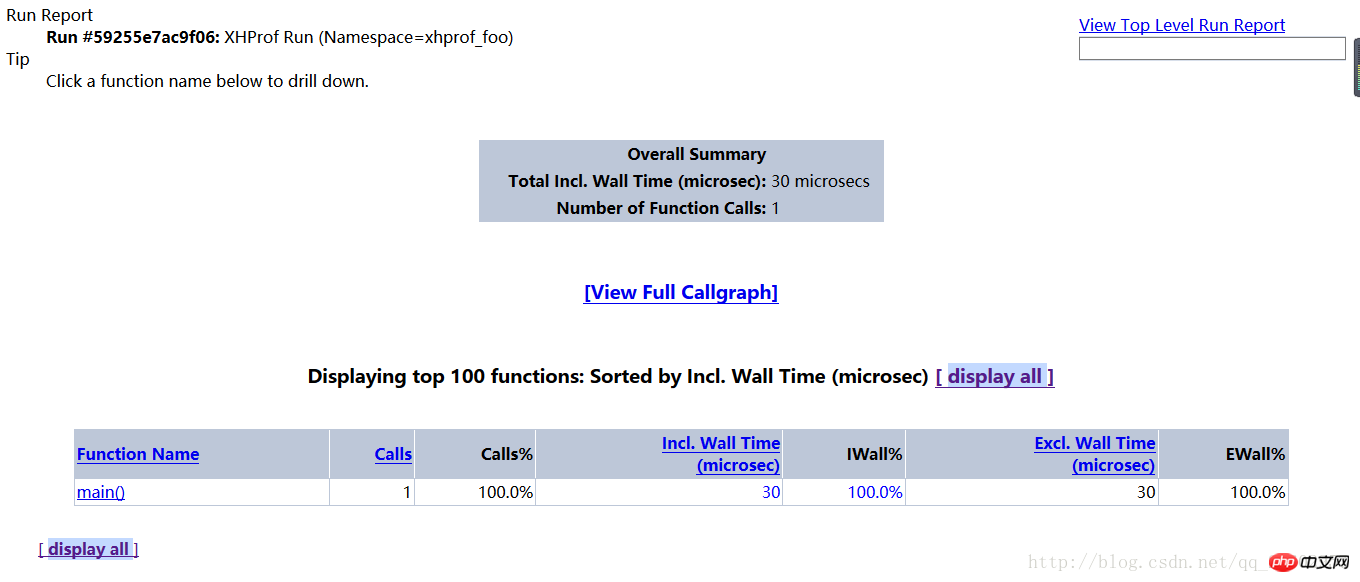
Click View Full Callgraph in the middle to see the performance analysis picture
Error reporting
failed to execute cmd:" dot -Tpng". stderr:sh: dot:command not found。
//解决方案yum install graphviz
Adapt to changes
For example, if you want to test your own project, such as a framework Performance analysis.
Copy the two files under xhprof_lib/utils/
xhprof_lib.php and xhprof_runs.php to the same directory as the entry file, and then add
// start profiling
xhprof_enable();
// stop profiler
$xhprof_data = xhprof_disable();

// display raw xhprof data for the profiler run
print_r($xhprof_data);


include_once "xhprof_lib.php";
include_once "xhprof_runs.php";

// save raw data for this profiler run using default
// implementation of iXHProfRuns.
$xhprof_runs = new XHProfRuns_Default();

// save the run under a namespace "xhprof_foo"
$run_id = $xhprof_runs->save_run($xhprof_data, "xhprof_foo");

echo "---------------\n".
     "Assuming you have set up the http based UI for \n".
     "XHProf at some address, you can view run at \n".
     "http://<xhprof-ui-address>/index.php?run=$run_id&source=xhprof_foo\n".
"---------------\n";http://***/xhprof_html/index.php?run=*****&source=xhprof_foo
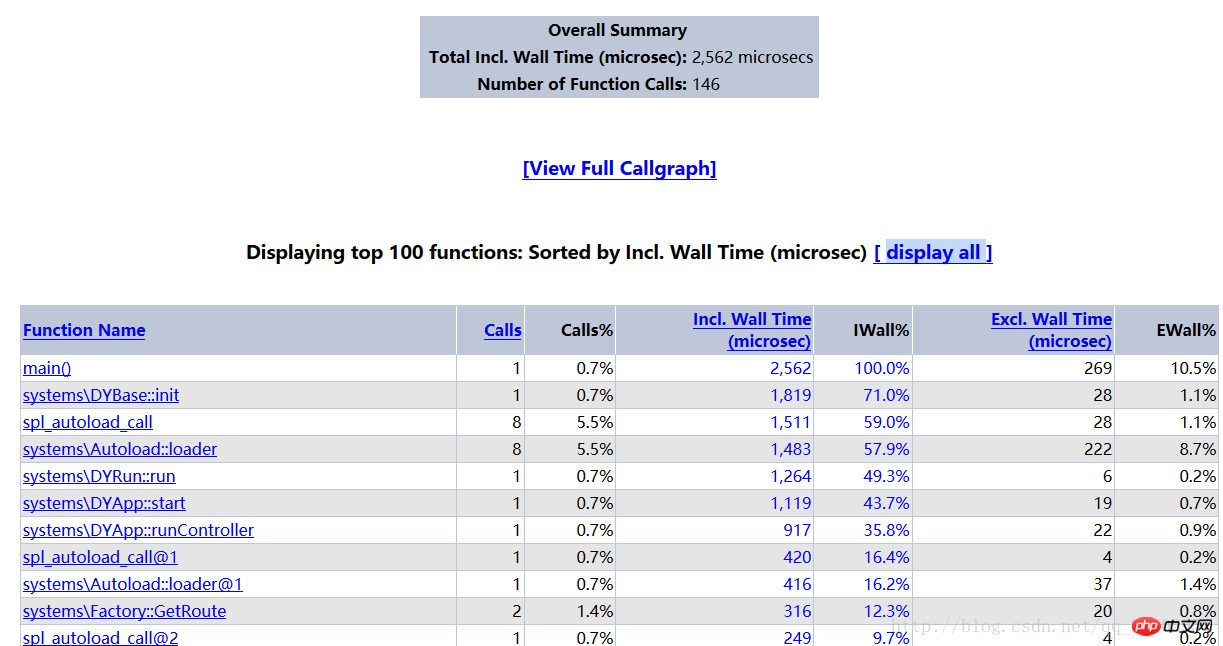
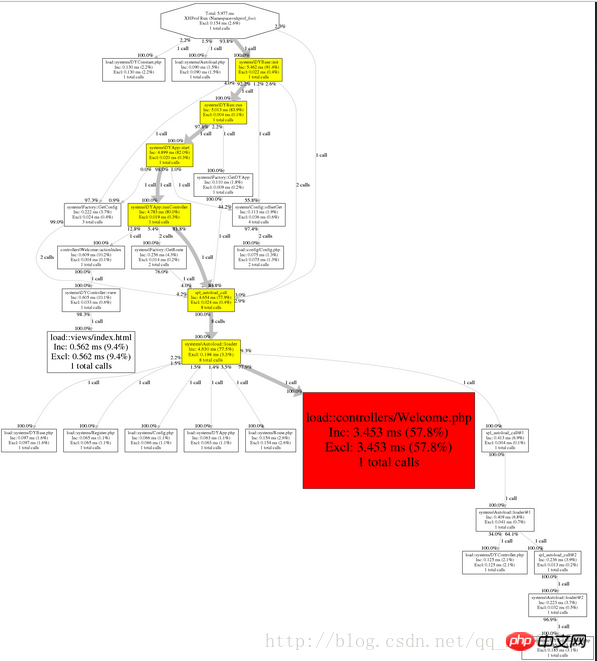
    Function Name:方法名称。

    Calls:方法被调用的次数。

    Calls%:方法调用次数在同级方法总数调用次数中所占的百分比。

    Incl.Wall Time(microsec):方法执行花费的时间,包括子方法的执行时间。(单位:微秒)

    IWall%:方法执行花费的时间百分比。

    Excl. Wall Time(microsec):方法本身执行花费的时间,不包括子方法的执行时间。(单位:微秒)

    EWall%:方法本身执行花费的时间百分比。

    Incl. CPU(microsecs):方法执行花费的CPU时间,包括子方法的执行时间。(单位:微秒)

    ICpu%:方法执行花费的CPU时间百分比。

    Excl. CPU(microsec):方法本身执行花费的CPU时间,不包括子方法的执行时间。(单位:微秒)

    ECPU%:方法本身执行花费的CPU时间百分比。

    Incl.MemUse(bytes):方法执行占用的内存,包括子方法执行占用的内存。(单位:字节)

    IMemUse%:方法执行占用的内存百分比。

    Excl.MemUse(bytes):方法本身执行占用的内存,不包括子方法执行占用的内存。(单位:字节)

    EMemUse%:方法本身执行占用的内存百分比。

    Incl.PeakMemUse(bytes):Incl.MemUse峰值。(单位:字节)

    IPeakMemUse%:Incl.MemUse峰值百分比。

    Excl.PeakMemUse(bytes):Excl.MemUse峰值。单位:(字节)

    EPeakMemUse%:Excl.MemUse峰值百分比。
Copy after login
Function Name:方法名称。
Calls:方法被调用的次数。
Calls%:方法调用次数在同级方法总数调用次数中所占的百分比。
Incl.Wall Time(microsec):方法执行花费的时间,包括子方法的执行时间。(单位:微秒)
IWall%:方法执行花费的时间百分比。
Excl. Wall Time(microsec):方法本身执行花费的时间,不包括子方法的执行时间。(单位:微秒)
EWall%:方法本身执行花费的时间百分比。
Incl. CPU(microsecs):方法执行花费的CPU时间,包括子方法的执行时间。(单位:微秒)
ICpu%:方法执行花费的CPU时间百分比。
Excl. CPU(microsec):方法本身执行花费的CPU时间,不包括子方法的执行时间。(单位:微秒)
ECPU%:方法本身执行花费的CPU时间百分比。
Incl.MemUse(bytes):方法执行占用的内存,包括子方法执行占用的内存。(单位:字节)
IMemUse%:方法执行占用的内存百分比。
Excl.MemUse(bytes):方法本身执行占用的内存,不包括子方法执行占用的内存。(单位:字节)
EMemUse%:方法本身执行占用的内存百分比。
Incl.PeakMemUse(bytes):Incl.MemUse峰值。(单位:字节)
IPeakMemUse%:Incl.MemUse峰值百分比。
Excl.PeakMemUse(bytes):Excl.MemUse峰值。单位:(字节)
EPeakMemUse%:Excl.MemUse峰值百分比。The above is the detailed content of Graphical code tutorial on the installation and use of xhprof performance analysis tool under php7. For more information, please follow other related articles on the PHP Chinese website!

Hot AI Tools

Undresser.AI Undress
AI-powered app for creating realistic nude photos

AI Clothes Remover
Online AI tool for removing clothes from photos.

Undress AI Tool
Undress images for free

Clothoff.io
AI clothes remover

Video Face Swap
Swap faces in any video effortlessly with our completely free AI face swap tool!

Hot Article

Hot Tools

Notepad++7.3.1
Easy-to-use and free code editor

SublimeText3 Chinese version
Chinese version, very easy to use

Zend Studio 13.0.1
Powerful PHP integrated development environment

Dreamweaver CS6
Visual web development tools

SublimeText3 Mac version
God-level code editing software (SublimeText3)

Hot Topics
 1664
1664
 14
14
 1422
1422
 52
52
 1316
1316
 25
25
 1267
1267
 29
29
 1240
1240
 24
24
 Explain JSON Web Tokens (JWT) and their use case in PHP APIs.
Apr 05, 2025 am 12:04 AM
JWT is an open standard based on JSON, used to securely transmit information between parties, mainly for identity authentication and information exchange. 1. JWT consists of three parts: Header, Payload and Signature. 2. The working principle of JWT includes three steps: generating JWT, verifying JWT and parsing Payload. 3. When using JWT for authentication in PHP, JWT can be generated and verified, and user role and permission information can be included in advanced usage. 4. Common errors include signature verification failure, token expiration, and payload oversized. Debugging skills include using debugging tools and logging. 5. Performance optimization and best practices include using appropriate signature algorithms, setting validity periods reasonably,
 PHP and Python: Comparing Two Popular Programming Languages
Apr 14, 2025 am 12:13 AM
PHP and Python each have their own advantages, and choose according to project requirements. 1.PHP is suitable for web development, especially for rapid development and maintenance of websites. 2. Python is suitable for data science, machine learning and artificial intelligence, with concise syntax and suitable for beginners.
 PHP in Action: Real-World Examples and Applications
Apr 14, 2025 am 12:19 AM
PHP is widely used in e-commerce, content management systems and API development. 1) E-commerce: used for shopping cart function and payment processing. 2) Content management system: used for dynamic content generation and user management. 3) API development: used for RESTful API development and API security. Through performance optimization and best practices, the efficiency and maintainability of PHP applications are improved.
 PHP: A Key Language for Web Development
Apr 13, 2025 am 12:08 AM
PHP is a scripting language widely used on the server side, especially suitable for web development. 1.PHP can embed HTML, process HTTP requests and responses, and supports a variety of databases. 2.PHP is used to generate dynamic web content, process form data, access databases, etc., with strong community support and open source resources. 3. PHP is an interpreted language, and the execution process includes lexical analysis, grammatical analysis, compilation and execution. 4.PHP can be combined with MySQL for advanced applications such as user registration systems. 5. When debugging PHP, you can use functions such as error_reporting() and var_dump(). 6. Optimize PHP code to use caching mechanisms, optimize database queries and use built-in functions. 7
 The Enduring Relevance of PHP: Is It Still Alive?
Apr 14, 2025 am 12:12 AM
PHP is still dynamic and still occupies an important position in the field of modern programming. 1) PHP's simplicity and powerful community support make it widely used in web development; 2) Its flexibility and stability make it outstanding in handling web forms, database operations and file processing; 3) PHP is constantly evolving and optimizing, suitable for beginners and experienced developers.
 Explain the match expression (PHP 8 ) and how it differs from switch.
Apr 06, 2025 am 12:03 AM
In PHP8, match expressions are a new control structure that returns different results based on the value of the expression. 1) It is similar to a switch statement, but returns a value instead of an execution statement block. 2) The match expression is strictly compared (===), which improves security. 3) It avoids possible break omissions in switch statements and enhances the simplicity and readability of the code.
 PHP vs. Python: Understanding the Differences
Apr 11, 2025 am 12:15 AM
PHP and Python each have their own advantages, and the choice should be based on project requirements. 1.PHP is suitable for web development, with simple syntax and high execution efficiency. 2. Python is suitable for data science and machine learning, with concise syntax and rich libraries.
 PHP vs. Other Languages: A Comparison
Apr 13, 2025 am 12:19 AM
PHP is suitable for web development, especially in rapid development and processing dynamic content, but is not good at data science and enterprise-level applications. Compared with Python, PHP has more advantages in web development, but is not as good as Python in the field of data science; compared with Java, PHP performs worse in enterprise-level applications, but is more flexible in web development; compared with JavaScript, PHP is more concise in back-end development, but is not as good as JavaScript in front-end development.


