
 Backend Development
PHP Tutorial
Example explanation of using XHProf to find PHP performance bottlenecks
Backend Development
PHP Tutorial
Example explanation of using XHProf to find PHP performance bottlenecks
Example explanation of using XHProf to find PHP performance bottlenecks
The editor below will share with you an example of using XHProf to find PHP performance bottlenecks. It has a good reference value and I hope it will be helpful to everyone. Let’s follow the editor to take a look.
XHProf is an extension developed by Facebook to test PHP performance. This article records the method of using XHProf to optimize PHP performance and find performance bottlenecks in PHP applications.
1. Install Xhprof extension
//github上下载https://github.com/facebook/xhprof
unzip xhprof-master.zip
cd xhprof-master/extension/
/usr/local/php/bin/phpize
./configure --with-php-config=/usr/local/php/bin/php-config --enable-xhprof
make && make install
2. Modify the xhprof.output_dir in the php.ini
[xhprof]
extension=xhprof.so
xhprof.output_dir=/tmp
configuration to specify the location where the generated profile file is stored. We specify it as / tmp.
3. Move the relevant files into the project
//xhprof下载压缩包中的xhprof_html和xhprof_lib
cp -r xhprof-master/xhprof_html /usr/local/nginx/html/xhprof/
cp -r xhprof-master/xhprof_lib /usr/local/nginx/html/xhprof/
Configure a domain name and browse The server can access http://will.com/xhprof/xhprof_html/index.php
server{
 listen 80;
 server_name will.com;
 location / {
  root /usr/local/nginx/html;
  index index.html;
 }
 location ~ \.php$ {
  root html;
  fastcgi_pass 127.0.0.1:9000;
  fastcgi_index index.php;
  fastcgi_param SCRIPT_FILENAME $document_root$fastcgi_script_name;
  include  fastcgi_params;
 }
}## 4. Install graphivz
//需要安装graphviz否则查看性能图片时候会报failed to execute cmd: " dot -Tpng". stderr: `sh: dot: command not found '
yum -y install graphviz
5. Write test files
//入口文件的开始位置
xhprof_enable(XHPROF_FLAGS_MEMORY | XHPROF_FLAGS_CPU);

业务逻辑...

//业务逻辑结束后
$xhprof_data = xhprof_disable();
include_once "/usr/local/nginx/html/xhprof/xhprof_lib/utils/xhprof_lib.php";
include_once "/usr/local/nginx/html/xhprof/xhprof_lib/utils/xhprof_runs.php";
$objXhprofRun = new XHProfRuns_Default();//数据会保存在php.ini中xhprof.output_dir设置的目录去中
$run_id = $objXhprofRun->save_run($xhprof_data, "test");
<?php
xhprof_enable(XHPROF_FLAGS_MEMORY | XHPROF_FLAGS_CPU);
function show($info)
{
echo "<pre class="brush:php;toolbar:false">";
print_r($info);
}
//不作数据校验
$rules = array(
2=>array('min'=>1, 'max'=>10, 'chance'=>30),//金额:分 概率:百分之(默认为100%,不足100%按第一档计算)
array('min'=>11, 'max'=>25, 'chance'=>60),
array('min'=>26, 'max'=>50, 'chance'=>10),
array('min'=>50, 'max'=>80, 'chance'=>0),
array('min'=>80, 'max'=>100, 'chance'=>0),
);
$total_money = 10000;//红包总金额
$res = array();
while($total_money>0)
{
$index = getLevel($rules);
$money = setMoney($rules, $index);
if ($money > $total_money)//金额不足
{
$money = $total_money;
$total_money = 0;
} else {
$total_money -= $money;
}
$res[] = ($index+1)."---".$money;
}
echo show($res);
echo $total_money . "<br/>";
//1.先确定档次
function getLevel($rules)
{
$level = array();
$chance = 0;
foreach($rules as $k=>$v)
{
if ($v['chance']>0)
{
$chance += $v['chance']*100;//扩大100倍
$level[$k] = $chance;
}
}
$index = 0;
$rand_num = mt_rand(1, 10000);
foreach($level as $k=>$v)
{
if ($rand_num <= $v)
{
$index = $k;
break;
}
}
return $index;
}
//2.确定档次之后,再确定金额
function setMoney($rules, $index)
{
$money = mt_rand($rules[$index]['min']*10000, $rules[$index]['max']*10000)/10000;
$money = ceil($money);
$money > 1 && $money = $money -1;//防止出现免单情况
return $money;
}
$xhprof_data = xhprof_disable();
include_once "/usr/local/nginx/html/xhprof/xhprof_lib/utils/xhprof_lib.php";
include_once "/usr/local/nginx/html/xhprof/xhprof_lib/utils/xhprof_runs.php";
$objXhprofRun = new XHProfRuns_Default();//数据会保存在php.ini中xhprof.output_dir设置的目录去中
$run_id = $objXhprofRun->save_run($xhprof_data, "test");
echo "http://will.com/xhprof/xhprof_html/index.php?run=$run_id&source=test";//变量$runId是本次请求生成分析结果的id,最后我们输出了一个链接地址,使用改地址就可以看到本次请求的分析结果。6. View analysis results
Run the business code first; Then the browser opens http://will.com/xhprof/xhprof_html/index.php, click the last time to generate the xhprof file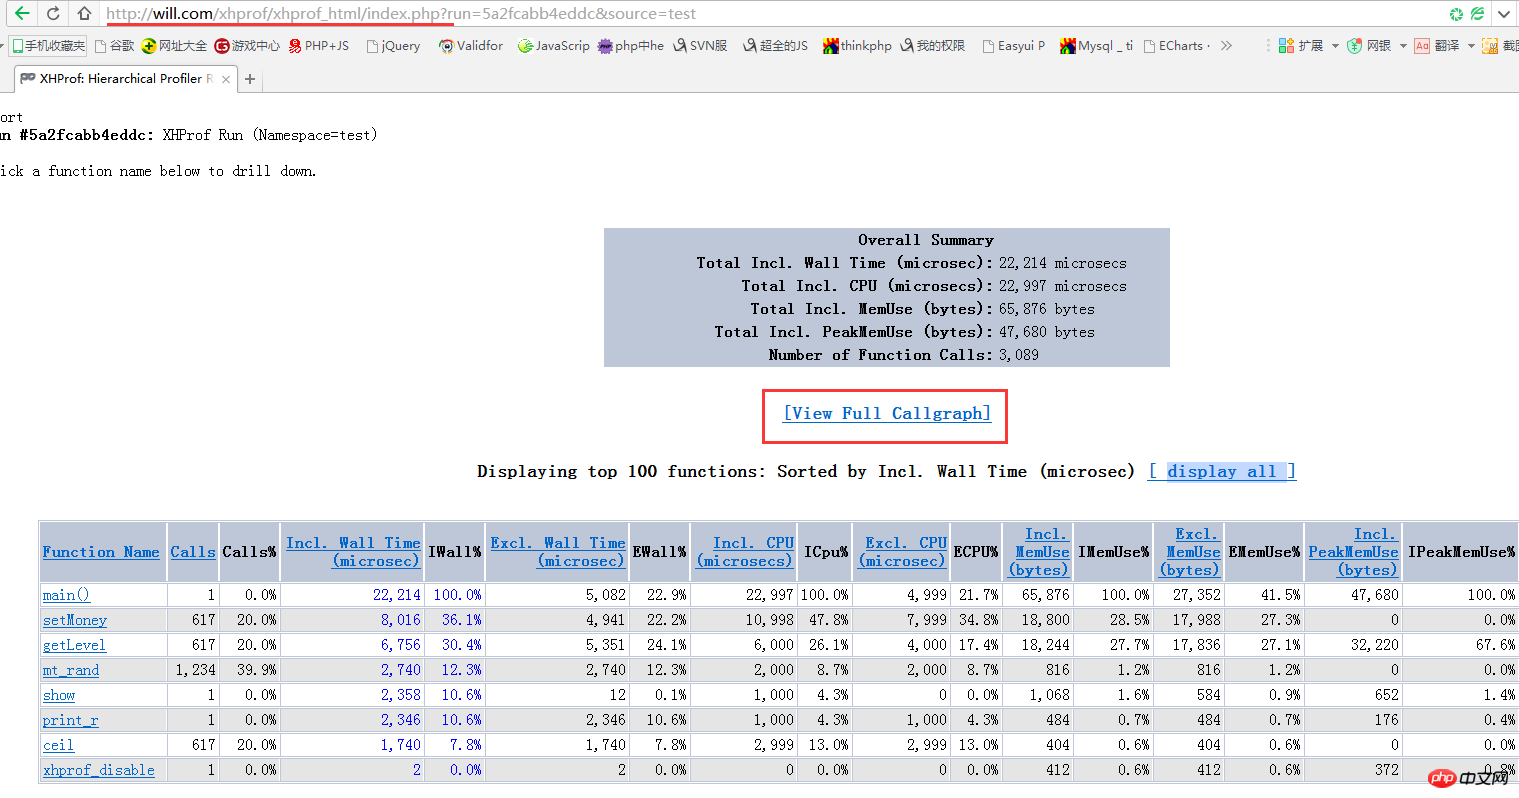
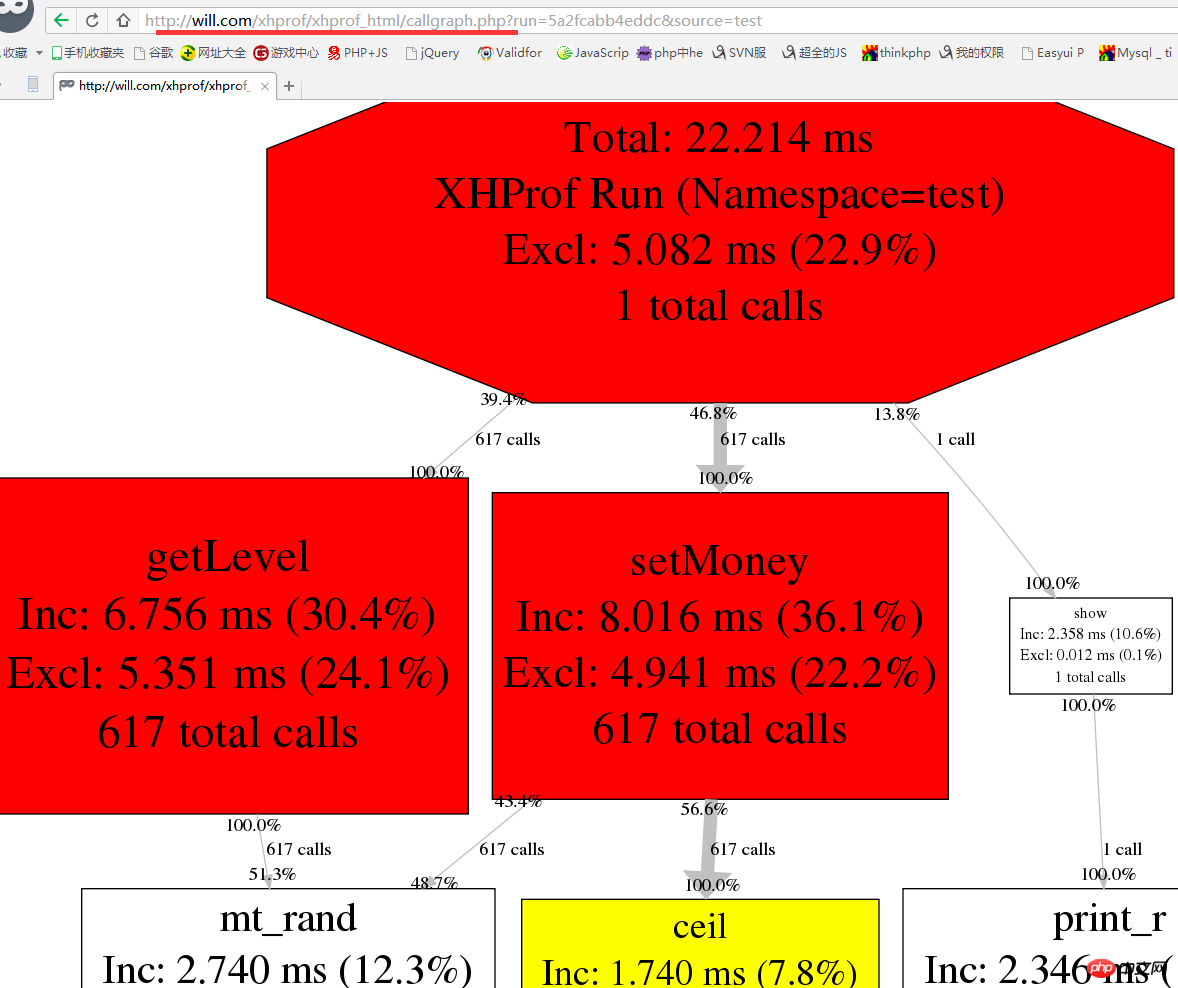
View Full Callgraph<span style="font-family:NSimsun"></span> link in the middle, through which we can see the graphical analysis results
In addition, xhprof report field meaning:
Function Name: method name. Calls: The number of times the method has been called. Calls%: The number of method calls as a percentage of the total number of method calls at the same level. Incl.Wall Time(microsec): The time it takes for method execution, including the execution time of sub-methods. (Unit: microseconds) IWall%: The percentage of time spent in method execution. Excl. Wall Time (microsec): The time it takes to execute the method itself, excluding the execution time of sub-methods. (Unit: microseconds) EWall%: The percentage of time spent executing the method itself. Incl. CPU(microsecs): The CPU time spent on method execution, including the execution time of sub-methods. (Unit: microseconds) ICpu%: The percentage of CPU time spent in method execution. Excl. CPU (microsec): The CPU time spent executing the method itself, excluding the execution time of sub-methods. (Unit: microseconds) ECPU%: The percentage of CPU time spent executing the method itself. Incl.MemUse(bytes): The memory occupied by method execution, including the memory occupied by sub-method execution. (Unit: bytes) IMemUse%: The percentage of memory occupied by method execution. Excl.MemUse(bytes): The memory occupied by the execution of the method itself, excluding the memory occupied by the execution of sub-methods. (Unit: bytes) EMemUse%: The percentage of memory occupied by the method itself. Incl.PeakMemUse(bytes): Incl.MemUse peak value. (Unit: Bytes) IPeakMemUse%: Incl.MemUse peak percentage. Excl.PeakMemUse(bytes): Excl.MemUse peak value. Unit: (byte) EPeakMemUse%: Excl.MemUse peak percentage. The above example of using XHProf to find PHP performance bottlenecks is all the content shared by the editor. I hope it can give you a reference, and I hope you will support the PHP Chinese website. Articles you may be interested in:Related summary of custom template directives in the Laravel framework
Example explanation of PHP recursive implementation of quick sorting method
Detailed explanation of PHP implementation of git deployment method tutorial
The above is the detailed content of Example explanation of using XHProf to find PHP performance bottlenecks. For more information, please follow other related articles on the PHP Chinese website!

Hot AI Tools

Undresser.AI Undress
AI-powered app for creating realistic nude photos

AI Clothes Remover
Online AI tool for removing clothes from photos.

Undress AI Tool
Undress images for free

Clothoff.io
AI clothes remover

Video Face Swap
Swap faces in any video effortlessly with our completely free AI face swap tool!

Hot Article
Hot Tools

Notepad++7.3.1
Easy-to-use and free code editor

SublimeText3 Chinese version
Chinese version, very easy to use

Zend Studio 13.0.1
Powerful PHP integrated development environment

Dreamweaver CS6
Visual web development tools

SublimeText3 Mac version
God-level code editing software (SublimeText3)
Hot Topics
 1668
1668
 14
1426
52
1328
25
1273
29
1255
24
14
1426
52
1328
25
1273
29
1255
24

 PHP: A Key Language for Web Development
Apr 13, 2025 am 12:08 AM
PHP: A Key Language for Web Development
Apr 13, 2025 am 12:08 AM
PHP is a scripting language widely used on the server side, especially suitable for web development. 1.PHP can embed HTML, process HTTP requests and responses, and supports a variety of databases. 2.PHP is used to generate dynamic web content, process form data, access databases, etc., with strong community support and open source resources. 3. PHP is an interpreted language, and the execution process includes lexical analysis, grammatical analysis, compilation and execution. 4.PHP can be combined with MySQL for advanced applications such as user registration systems. 5. When debugging PHP, you can use functions such as error_reporting() and var_dump(). 6. Optimize PHP code to use caching mechanisms, optimize database queries and use built-in functions. 7
 PHP and Python: Comparing Two Popular Programming Languages
Apr 14, 2025 am 12:13 AM
PHP and Python: Comparing Two Popular Programming Languages
Apr 14, 2025 am 12:13 AM
PHP and Python each have their own advantages, and choose according to project requirements. 1.PHP is suitable for web development, especially for rapid development and maintenance of websites. 2. Python is suitable for data science, machine learning and artificial intelligence, with concise syntax and suitable for beginners.
 PHP vs. Python: Understanding the Differences
Apr 11, 2025 am 12:15 AM
PHP vs. Python: Understanding the Differences
Apr 11, 2025 am 12:15 AM
PHP and Python each have their own advantages, and the choice should be based on project requirements. 1.PHP is suitable for web development, with simple syntax and high execution efficiency. 2. Python is suitable for data science and machine learning, with concise syntax and rich libraries.
 PHP in Action: Real-World Examples and Applications
Apr 14, 2025 am 12:19 AM
PHP in Action: Real-World Examples and Applications
Apr 14, 2025 am 12:19 AM
PHP is widely used in e-commerce, content management systems and API development. 1) E-commerce: used for shopping cart function and payment processing. 2) Content management system: used for dynamic content generation and user management. 3) API development: used for RESTful API development and API security. Through performance optimization and best practices, the efficiency and maintainability of PHP applications are improved.
 The Enduring Relevance of PHP: Is It Still Alive?
Apr 14, 2025 am 12:12 AM
The Enduring Relevance of PHP: Is It Still Alive?
Apr 14, 2025 am 12:12 AM
PHP is still dynamic and still occupies an important position in the field of modern programming. 1) PHP's simplicity and powerful community support make it widely used in web development; 2) Its flexibility and stability make it outstanding in handling web forms, database operations and file processing; 3) PHP is constantly evolving and optimizing, suitable for beginners and experienced developers.
 PHP vs. Other Languages: A Comparison
Apr 13, 2025 am 12:19 AM
PHP vs. Other Languages: A Comparison
Apr 13, 2025 am 12:19 AM
PHP is suitable for web development, especially in rapid development and processing dynamic content, but is not good at data science and enterprise-level applications. Compared with Python, PHP has more advantages in web development, but is not as good as Python in the field of data science; compared with Java, PHP performs worse in enterprise-level applications, but is more flexible in web development; compared with JavaScript, PHP is more concise in back-end development, but is not as good as JavaScript in front-end development.
 PHP and Python: Different Paradigms Explained
Apr 18, 2025 am 12:26 AM
PHP and Python: Different Paradigms Explained
Apr 18, 2025 am 12:26 AM
PHP is mainly procedural programming, but also supports object-oriented programming (OOP); Python supports a variety of paradigms, including OOP, functional and procedural programming. PHP is suitable for web development, and Python is suitable for a variety of applications such as data analysis and machine learning.
 PHP and Python: Code Examples and Comparison
Apr 15, 2025 am 12:07 AM
PHP and Python: Code Examples and Comparison
Apr 15, 2025 am 12:07 AM
PHP and Python have their own advantages and disadvantages, and the choice depends on project needs and personal preferences. 1.PHP is suitable for rapid development and maintenance of large-scale web applications. 2. Python dominates the field of data science and machine learning.
