Preface
ROC (Receiver Operating Characteristic) curve and AUC are often used to evaluate the quality of a binary classifier. This article will first briefly introduce ROC and AUC, and then use examples to demonstrate how to make ROC curves and calculate AUC in python.
AUC introduction
AUC (Area Under Curve) is a very commonly used evaluation index in machine learning binary classification models. Compared with Since F1-Score has greater tolerance for project imbalances, currently common machine learning libraries (such as scikit-learn) generally integrate the calculation of this indicator, but sometimes the model is separate or written by itself. , at this time, if you want to evaluate the quality of the training model, you have to build an AUC calculation module yourself. When searching for information, this article found that libsvm-tools has a very easy-to-understand AUC calculation, so I picked it out for future use.
AUC calculation
The calculation of AUC is divided into the following three steps:
1. Preparation of calculation data. If there is only a training set during model training, cross-validation is generally used to calculate it. If there is an evaluation set (evaluate), it can usually be calculated directly. The format of the data generally requires the prediction score and its target category (note It is the target category, not the predicted category)
2. Get the horizontal (X: False Positive Rate) and vertical (Y: True Positive Rate) points according to the threshold division
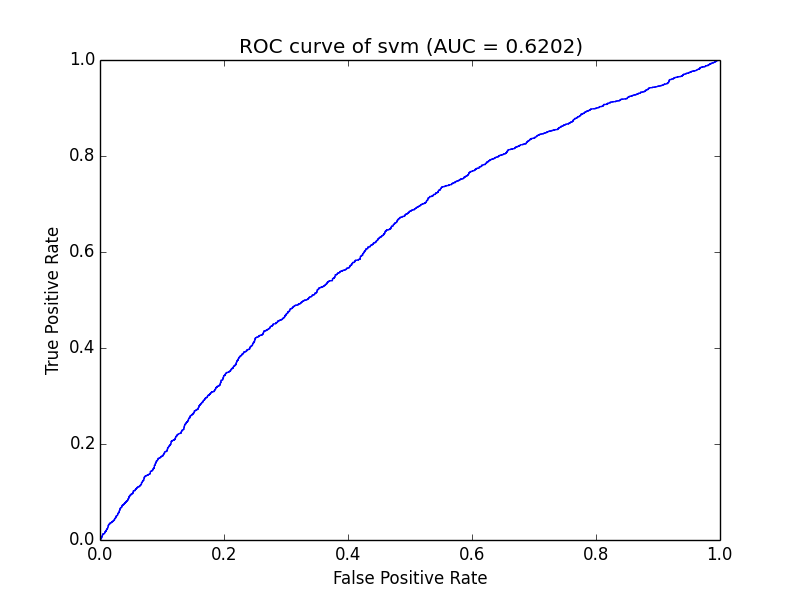
3 , after connecting the coordinate points into a curve, calculate the area under the curve, which is the value of AUC
Go directly to the python code
##
#! -*- coding=utf-8 -*-
import pylab as pl
from math import log,exp,sqrt


evaluate_result="you file path"
db = [] #[score,nonclk,clk]
pos, neg = 0, 0
with open(evaluate_result,'r') as fs:
 for line in fs:
 nonclk,clk,score = line.strip().split('\t')
 nonclk = int(nonclk)
 clk = int(clk)
 score = float(score)
 db.append([score,nonclk,clk])
 pos += clk
 neg += nonclk


db = sorted(db, key=lambda x:x[0], reverse=True)

#计算ROC坐标点
xy_arr = []
tp, fp = 0., 0.
for i in range(len(db)):
 tp += db[i][2]
 fp += db[i][1]
 xy_arr.append([fp/neg,tp/pos])

#计算曲线下面积
auc = 0.
prev_x = 0
for x,y in xy_arr:
 if x != prev_x:
 auc += (x - prev_x) * y
 prev_x = x

print "the auc is %s."%auc

x = [_v[0] for _v in xy_arr]
y = [_v[1] for _v in xy_arr]
pl.title("ROC curve of %s (AUC = %.4f)" % ('svm',auc))
pl.xlabel("False Positive Rate")
pl.ylabel("True Positive Rate")
pl.plot(x, y)# use pylab to plot x and y
pl.show()# show the plot on the screenThe format is:
nonclk \t clk \t score
Among them: 1. nonclick: unclicked data, which can be regarded as the number of negative samples

Note
For more articles related to Python drawing ROC curve and AUC value calculation, please pay attention to the PHP Chinese website!


