This article mainly introduces the method of using python to use the openpyxl library to modify excel table data. It has a certain reference value. Now I share it with you. Friends in need can refer to it
1. The openpyxl library can read and write files in xlsx format. For files in the old xls format, you can only use xlrd to read and xlwt to write.
Simple encapsulation class:
from openpyxl import load_workbook
from openpyxl import Workbook
from openpyxl.chart import BarChart, Series, Reference, BarChart3D
from openpyxl.styles import Color, Font, Alignment
from openpyxl.styles.colors import BLUE, RED, GREEN, YELLOW
class Write_excel(object):
  def __init__(self,filename):
    self.filename = filename
    self.wb = load_workbook(self.filename)
    self.ws = self.wb.active
  def write(self, coord, value):
    # eg: coord:A1
    self.ws.cell(coord).value = value
    self.wb.save(self.filename)
  def merge(self, rangstring):
    # eg: rangstring:A1:E1
    self.ws.merge_cells(rangstring)
    self.wb.save(self.filename)
  def cellstyle(self, coord, font, align):
    cell = self.ws.cell(coord)
    cell.font = font
    cell.alignment = align
  def makechart(self, title, pos, width, height, col1, row1, col2, row2, col3, row3, row4):
    ''':param title:图表名
         pos:图表位置
         width:图表宽度
         height:图表高度
    '''
    data = Reference(self.ws, min_col=col1, min_row=row1, max_col=col2, max_row=row2)
    cat = Reference(self.ws, min_col=col3, min_row=row3, max_row=row4)
    chart = BarChart3D()
    chart.title = title
    chart.width = width
    chart.height = height
    chart.add_data(data=data, titles_from_data=True)
    chart.set_categories(cat)
    self.ws.add_chart(chart, pos)
self.wb.save(self.filename)Simple use:
1. New excel file processing
wb = Workbook()#创建工作簿
ws = wb.active#激活工作表
ws1 = wb.create_sheet("Mysheet")#创建mysheet表
ws.title = "New Title"#表明改为New Title
ws.sheet_properties.tabColor = "1072BA"#颜色
ws['A4'] = 4#赋值
d = ws.cell(row=4, column=2, value=10)#赋值
cell_range = ws['A1':'C2']#选择单元格区域
wb.save('test.xlsx')#保存2 , Processing of existing excel files
a. Modify excel data
wr = Write_excel('d:\demo.xlsx')
wr.write('A2','hello')
b. Merge cells
wr.merge('A1:B3')
c. Add styles to cells, such as fonts, colors and other attributes
Cell B2 sets Song Dynasty, size 14, red, automatic line wrapping, horizontal centering, vertical centering
font = Font(name=u'宋体', size=14, color=RED, bold=True)
align = Alignment(horizontal='center', vertical='center')
wr.cellstyle('B2', font, align)
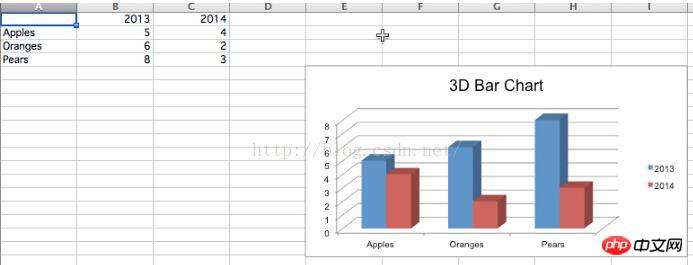
d, create a 3d column Chart
rows = [
  (None, 2013, 2014),
  ("Apples", 5, 4),
  ("Oranges", 6, 2),
  ("Pears", 8, 3)
]

for row in rows:
  ws.append(row)

wr.makechart(u"3D Bar Chart", 'E5', 12.5, 7, 2, 1, 3, 4, 1, 2, 4)
can create 3D column and line charts, which is very easy to use.
Related recommendations:
Examples of image reading and cutting functions implemented by Python using matplotlib
Python uses the email module Encode and decode messages
The above is the detailed content of python uses openpyxl library to modify excel table data method. For more information, please follow other related articles on the PHP Chinese website!
 python development tools
 python packaged into executable file
 what python can do
 Compare the similarities and differences between two columns of data in excel
 excel duplicate item filter color
 How to use format in python
 How to copy an Excel table to make it the same size as the original
 Excel table slash divided into two


