
This article mainly introduces the example code of the WeChat applet chart plug-in (wx-charts), which has certain reference value. Interested friends can refer to it.
Charts for WeChat small app
Based on canvas drawing, small size
Support chart types
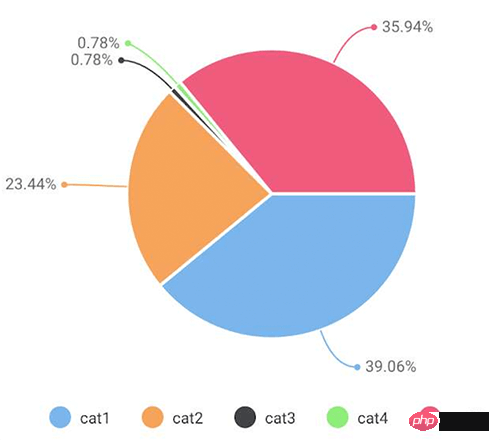
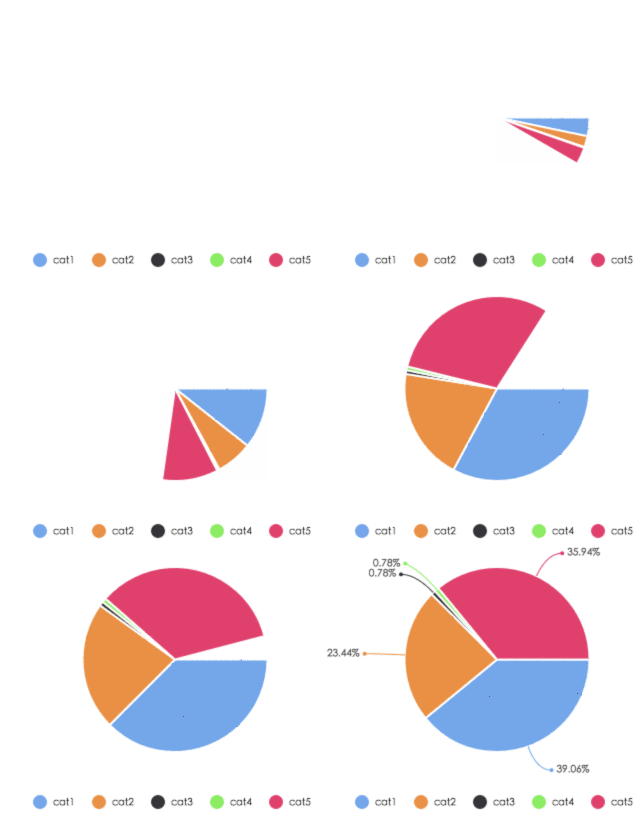
pie chartpie
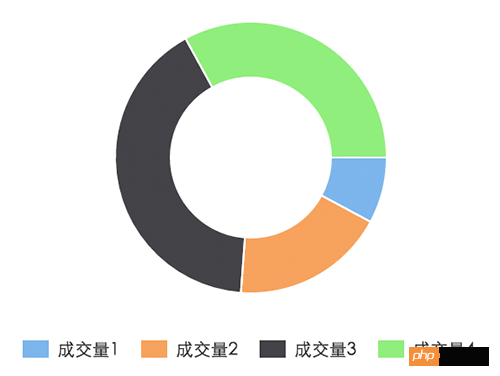
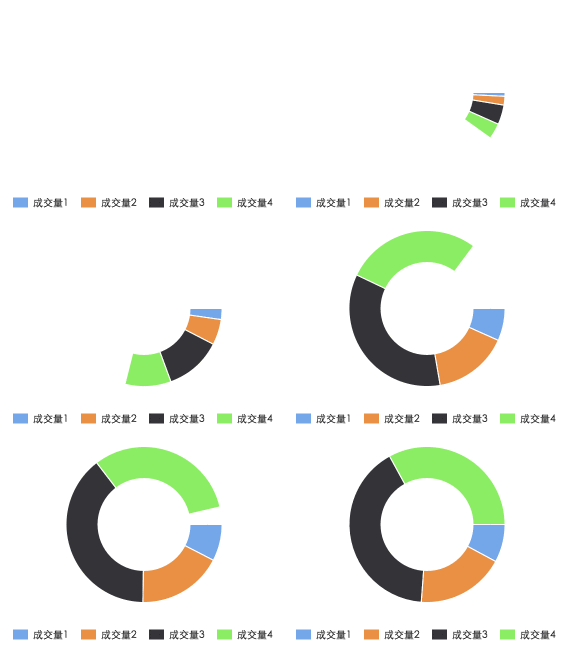
Donut chart ring
line chart line
Bar chart column
Region chart area
Code analysisHere
Parameter description
opts Object
opts.canvasId String required WeChat applet canvas-id
opts.width Number required canvas width, unit is px
opts.height Number required canvas height, unit is px
opts.title Object (only for ring chart)
opts.title.name String Title content
opts.title.fontSize Number Title font size (optional, unit is px)
opts.title.color String Title color (optional)
opts.subtitle Object (only for ring chart )
opts.subtitle.name String Subtitle content
opts.subtitle.fontSize Number Subtitle font size (optional, unit is px)
opts.subtitle.color String Subtitle color (optional)
opts.animation Boolean default true Whether to display animation
opts.legend Boolean default true Whether to display the identification of each category below the chart
opts.type String required Chart type, optional values are pie, line, column, area, ring
opts.categories Array required (not required for pie charts and donut charts) Data category classification
opts. dataLabel Boolean default true Whether to display the data content value in the chart
opts.dataPointShape Boolean default true Whether to display the graphic identifier of the data point in the chart
opts.xAxis Object X-axis configuration
opts.xAxis.disableGrid Boolean default false Do not draw the X-axis grid
opts.yAxis Object Y-axis configuration
opts.yAxis.format Function Customize the Y-axis copy display
opts.yAxis.min Number Y-axis starting value
opts.yAxis.max Number Y-axis ending value
opts.yAxis.title String Y-axis title
opts.yAxis.disabled Boolean default false Do not draw the Y axis
opts.series Array required Data list
Data list structure definition for each item
dataItem Object
dataItem.data Array required (Number for pie chart and donut chart) data
dataItem.color String For example, #7cb5ec If not passed in, the system default color scheme will be used
dataItem.name String Data name
dateItem.format Function Customized display data content
Example
pie chart
var wxCharts = require('wxcharts.js');
new wxCharts({
 canvasId: 'pieCanvas',
 type: 'pie',
 series: [{
  name: 'cat1',
  data: 50,
 }, {
  name: 'cat2',
  data: 30,
 }, {
  name: 'cat3',
  data: 1,
 }, {
  name: 'cat4',
  data: 1,
 }, {
  name: 'cat5',
  data: 46,
 }],
 width: 360,
 height: 300,
 dataLabel: true
});
##ring chart
new wxCharts({
 canvasId: 'ringCanvas',
 type: 'ring',
 series: [{
  name: '成交量1',
  data: 15,
 }, {
  name: '成交量2',
  data: 35,
 }, {
  name: '成交量3',
  data: 78,
 }, {
  name: '成交量4',
  data: 63,
 }],
 width: 320,
 height: 200,
 dataLabel: false
});
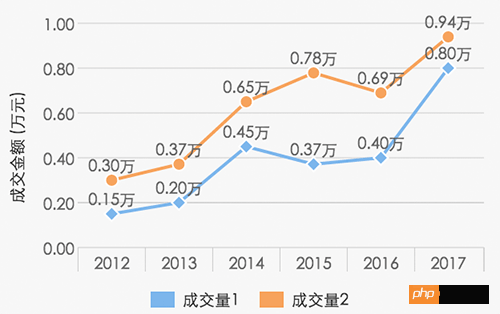
new wxCharts({
 canvasId: 'lineCanvas',
 type: 'line',
 categories: ['2012', '2013', '2014', '2015', '2016', '2017'],
 series: [{
  name: '成交量1',
  data: [0.15, 0.2, 0.45, 0.37, 0.4, 0.8],
  format: function (val) {
   return val.toFixed(2) + '万';
  }
 }, {
  name: '成交量2',
  data: [0.30, 0.37, 0.65, 0.78, 0.69, 0.94],
  format: function (val) {
   return val.toFixed(2) + '万';
  }
 }],
 yAxis: {
  title: '成交金额 (万元)',
  format: function (val) {
   return val.toFixed(2);
  },
  min: 0
 },
 width: 320,
 height: 200
});
 ##Introduction to WeChat applet chart plug-in (wx-charts)
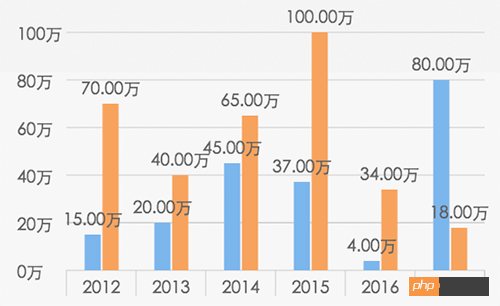
new wxCharts({
 canvasId: 'columnCanvas',
 type: 'column',
 categories: ['2012', '2013', '2014', '2015', '2016', '2017'],
 series: [{
  name: '成交量1',
  data: [15, 20, 45, 37, 4, 80]
 }, {
  name: '成交量2',
  data: [70, 40, 65, 100, 34, 18]
 }],
 yAxis: {
  format: function (val) {
   return val + '万';
  }
 },
 width: 320,
 height: 200
});
##Introduction to WeChat applet chart plug-in (wx-charts)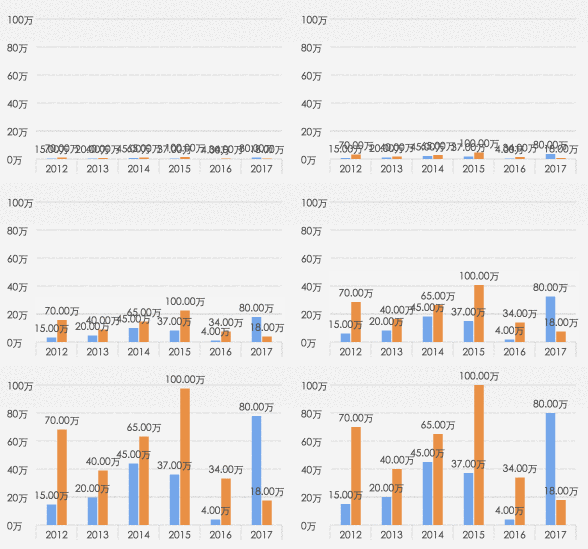
Introduction to the bottom navigation of tabBar in WeChat mini program The above is the detailed content of Introduction to WeChat applet chart plug-in (wx-charts). For more information, please follow other related articles on the PHP Chinese website!new wxCharts({
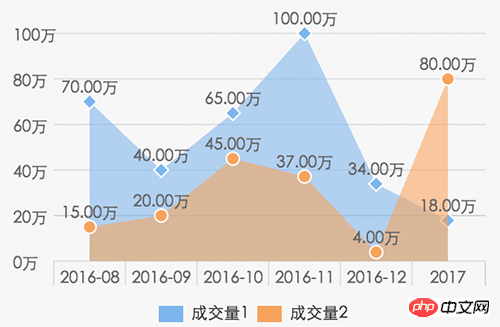
canvasId: 'areaCanvas',
type: 'area',
categories: ['2016-08', '2016-09', '2016-10', '2016-11', '2016-12', '2017'],
series: [{
name: '成交量1',
data: [70, 40, 65, 100, 34, 18],
format: function (val) {
return val.toFixed(2) + '万';
}
}, {
name: '成交量2',
data: [15, 20, 45, 37, 4, 80],
format: function (val) {
return val.toFixed(2) + '万';
}
}],
yAxis: {
format: function (val) {
return val + '万';
}
},
width: 320,
height: 200
});
 Related recommendations:


