

Chartify
 Use now


Introduction:
Added on:
Monthly Visitors:
Chartify is an AI tool that turns data into interactive charts and recommends chart types.
Dec-14 2024
 0
0
0
Website
AI Charting

Product Information
What is Chartify?
Chartify is an AI-generated charting tool that allows users to turn CSVs and>
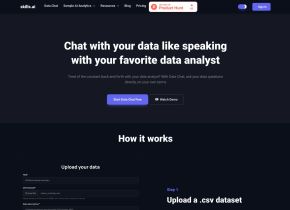
How to use Chartify?
To use Chartify, follow these steps: 1. Upload your>
Chartify's Core Features
AI-generated visualizations
Support for CSV files and> Wide range of charting options, including pie charts, line graphs, bar charts, and more
Integration with Plotly, Matplotlib, Seaborn, and Charts.js
Chartify's Use Cases
Data analysis
Data visualization
Reporting
Presentations
Business intelligence
Related resources


Hot Article
Training Large Language Models: From TRPO to GRPO
3 weeks ago
By 王林
AI-Powered Information Extraction and Matchmaking
3 weeks ago
By 王林
LLMs.txt Explained
3 weeks ago
By WBOYWBOYWBOYWBOYWBOYWBOYWBOYWBOYWBOYWBOYWBOYWBOYWB
How LLMs Work: Pre-Training to Post-Training, Neural Networks, Hallucinations, and Inference
3 weeks ago
By WBOYWBOYWBOYWBOYWBOYWBOYWBOYWBOYWBOYWBOYWBOYWBOYWB
How to Use an LLM-Powered Boilerplate for Building Your Own Node.js API
3 weeks ago
By WBOYWBOYWBOYWBOYWBOYWBOYWBOYWBOYWBOYWBOYWBOYWBOYWB