debug
As the saying goes, "If you want to do your job well, you must first sharpen your tools." When writing JavaScript, if you expect to display ABC but the result is XYZ, what is the problem with the code? Don't get mad or get discouraged. As a novice, you must firmly believe that there is no problem with JavaScript itself, and there is no problem with browser execution. The problem must be my code.
How to find the problem code? This requires debugging.
How to debug JavaScript code in the browser?
First of all, you need to install the Google Chrome browser. The Chrome browser is very developer-friendly and allows you to easily debug JavaScript code. Download Chrome browser from here. If there is a problem opening the webpage, please move to the domestic mirror.
After installation, open a web page at random, then click the menu "View"-"Developer"-"Developer Tools", the browser window will be divided into Second, below are the developer tools:

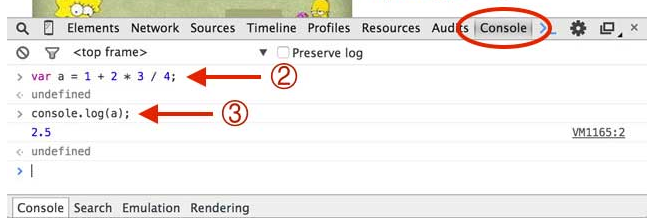
First click "Console". In this panel, you can directly enter JavaScript code and press Enter to execute it.
To view the content of a variable, enter console.log(a); in the Console, and the value displayed after pressing Enter is the content of the variable.
To close the Console, please click the "×" button in the upper right corner. Please be proficient in using Console. When writing JavaScript code, you often need to run test code in Console.
If you have higher requirements for yourself, you can study the "Sources" of the developer tools and master advanced debugging skills such as breakpoints and single-step execution.


