 Backend Development
 C#.Net Tutorial
 Share 10 debugging tips for Visual Studio native development
Share 10 debugging tips for Visual Studio native development
This article only introduces some basic debugging techniques for Visual Studio, but there are other techniques that are equally useful. I have compiled some debugging tips for native development in Visual Studio (at least under VS 2008). (If you are working under managed code, the debugger will have more features, and there are articles introducing them in CodeProject). Here are some tips I compiled:
Break on Exception |
Pseudo-variables in Watch Windows
View the heap object after the symbol is out of bounds| | Launch the debugger from code
Print in the Output window
Isolate memory leak
Debug the release version | Debug the Release Build
Remote debugging
Tip 1: Abnormal interruption
Before the handler is called, the debugger can be started to interrupt when an exception occurs, allowing you to debug the program immediately after the exception occurs. Manipulating the call stack allows you to find the root cause of an exception.
Vistual Studio allows you to specify the exception type or special exception you want to interrupt. Select the menu Debug>Exceptions and a dialog box will pop up. You can specify native (or managed) exceptions. In addition to some of the default exceptions that come with the debugger, you can also add your own custom exceptions.
The following is an example of the debugger interrupting when a std::exception exception is thrown. 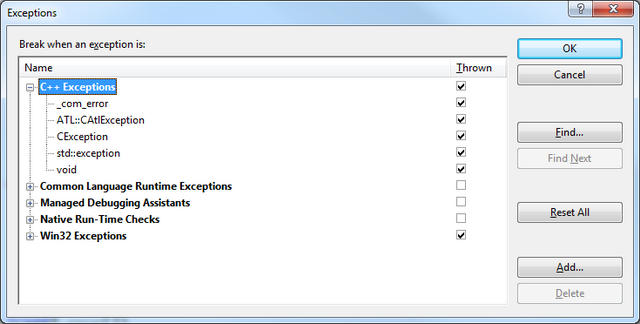
Tip 2: Pseudo variables in the Watch window 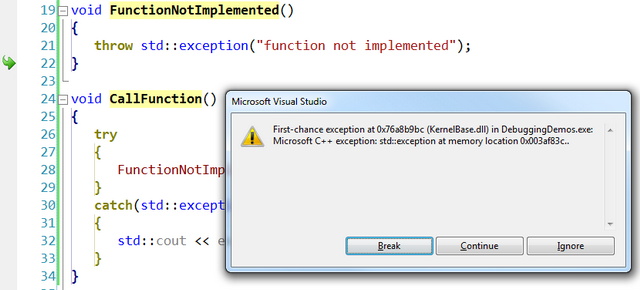
$tid——–The thread ID of the current thread
$pid——The process ID
$cmdline————The command line string to start the program
$user— ——-Account information of the running program
$registername——-Display the contents of register registername
In any case, the pseudo variable about the last error is very useful:
$err—— – Display the error code of the last error
$err,hr—Display the error message of the last error
Tip 3: Check the heap object after meeting the boundary 
In the following example, after stepping out of do_foo(), _foo can no longer be accessed. However, after converting its address to foo*, you can continue to observe this object.
Tip 4: View the value of the array 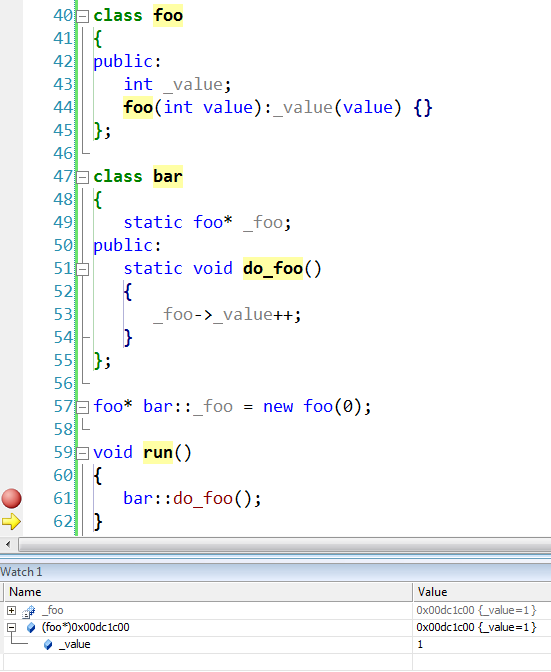
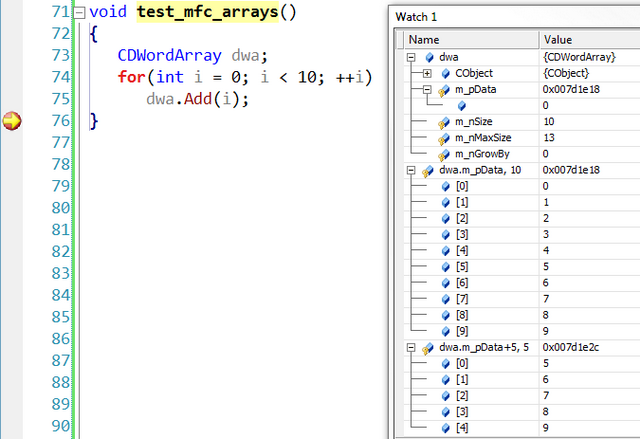
If your array is on the heap, you can expand it in the watch window, But to view a specific range of values, the usage is slightly different: ((T*) array + 
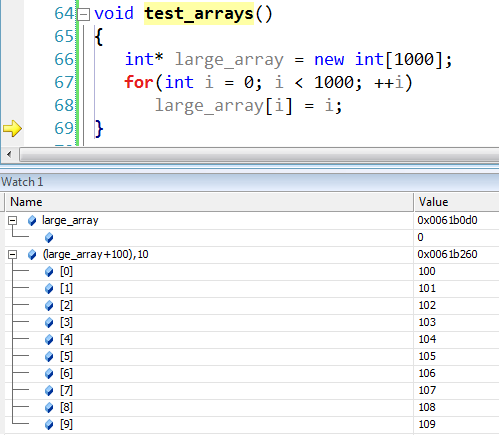
If you are using MFC, and use the 'array' container, such as CArray, CDWordArray, CStringArray, etc. You can of course use the same filtering method. Beyond that, you have to look at the m_pData member of the array, which is the actual cache that holds the data.
Tip 5: Avoid entering unnecessary functions
Many times, when debugging code, you may enter a function you want to skip, like Constructor, assignment operation or other. The one that bothers me the most is the CString constructor. The following is an example. When you are ready to step into the take_a_string() function, first enter the CString constructor.
void take_a_string(CString const &text){}void test_string(){ take_a_string(_T("sample"));}

Fortunately you can Tell the debugger which methods, classes or entire namespaces to skip. The method of doing this has also changed, back to the days of VS6 it was usually specified via the autoexp.dat file. Vistual Studio 2002 changed to use registry settings. To skip some functions, you need to add some values in the registry (details below):
The actual location depends on the version of Vistual Studio you are using and the operating system platform (x86 or x64, because the registry only Can be browsed under 64-bit Windows) The name of the value is a number, representing the priority of the rule; the larger the number, the higher the priority. The value data is a REG_SZ value of a regular expression that specifies how to filter and execute.
To avoid entering any CString methods, I added the following rule:

With this, even if you force enter take_a_string() in the above example , the debugger will also skip the constructor of CString.
Tip 6: Launch the debugger from code
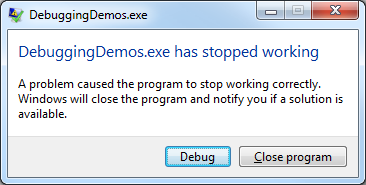
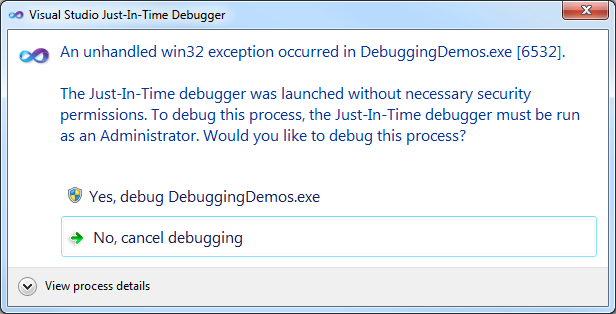
You may rarely need to attach the debugger to a program, but you cannot do so in the Attach window (possibly because of interrupts happens too fast to be caught), you also can't start the program in the debugger at the beginning. You can generate a break in your program to give the debugger a chance to attach by calling _degbugbreak() internally.
void break_for_debugging() {
__debugbreak();
}There are actually other ways to do it, such as triggering interrupt 3, but this only applies to the x86 platform (ASM is no longer supported in C++ 64-bit). There is also the DebugBreak() function, but its use is not very easy, so it is recommended to use the internal method here.
__asm int 3;
The program will stop running when it runs an internal method. At this time, you have the opportunity to attach a debugger to the process.

Tip 7: Print in the output window
You can do this by calling DebugOutputString Display a specific text in the debugger's output window. If there is no debugger attached, this function does nothing.

技巧8:隔离内存泄漏
内存泄漏是在原生开发中的一个很重要的问题,要检测内存泄漏是一个很严峻的挑战,尤其是在大型项目中。Vistual Studio可以提供检测内存泄漏的报告,还有其他的一些应用程序(免费的或商业的)也可以帮助你检测内存泄漏.有些情况下,在一些内存分配最终会导致泄漏时,可以使用调试器去中断。但是你必须找到可再现的分配编号(尽管没那么容易)。如果能做到这一点,执行程序时调试器才会中断。
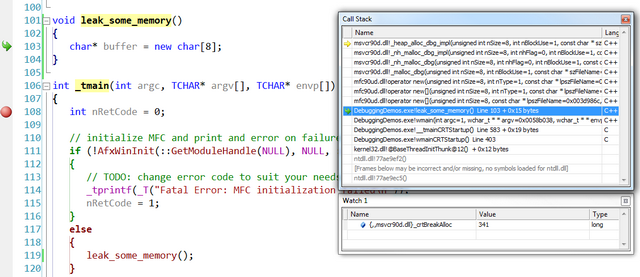
我们来看下面的代码,分配了8个字节,却一直没释放分配的内存。Visual Studio提供了造成内存泄漏的对象的报告,多运行几次,会发现一直是同一个分配编号(341)。
void leak_some_memory()
{
char* buffer = new char[8];
}
Dumping objects ->
d:\marius\vc++\debuggingdemos\debuggingdemos.cpp(103) : {341} normal block at 0x00F71F38, 8 bytes long.
Data: < > CD CD CD CD CD CD CD CD在一个特定的(可复现的)位置中断的步骤如下:
确定你有足够的关于内存泄漏的报告模式(参考 使用CRT库检测内存泄漏)
多次运行程序直到你能在程序运行结束后的内存泄漏报告里找到一个可复现的分配编号,例如上个例子中的(341)
在程序一开始的地方设置一个断点以便你能够尽早地进行中断。
当最初的中断发生时,watch窗口的Name栏里会显示:{,,msvcr90d.dll}_crtBreakAlloc,在Value栏里写入你想要查找的位置编号
继续调试(F5)
程序执行到指定位置会停止,你可以使用调用栈被指引找到被该位置触发的那段代码。
遵循这些步骤, 在上个例子中,使用分配的编号(341)就可以识别内存泄漏的起因。
技巧9:调试发行版
调试和发布是两个不同的目的。调试配置是用于开发的,而发布配置,顾名思义,是用来作为程序的最终版本,因为它必须严格遵循发布的质量要求,该配置包含优化部分和调试版本的中断调试的设置。而且,有时候,要像调试调试版本一样去调试发行版。要做到这一点,你需要在配置里做一些改变。但是这种情况下,你就不再是在调试发行版,而是调试和发行的混合版

你还应该做一些事儿,以下是必须要做的:
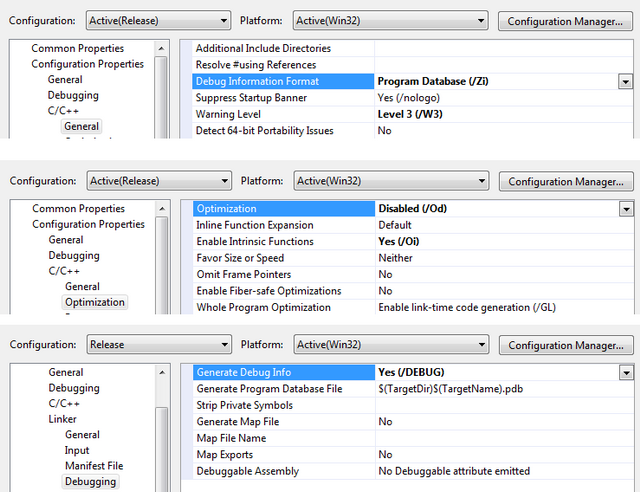
配置C/C++ >General>Debug Information Format 应该为 “Program Database(/Zi)”
配置C/C++ >Optimization>Optimization 应该为”Disabld(/Od)”
配置Linker>Debugging>Generate Debug Info 应该为”Yes/(DEBUG)”
如图所示:
技巧10:远程调试
另一个重要的调试就是远程调试,这是一个更大的话题,多次被提到,这里我只做一下简单的概括:
你需要在远程机器上安装远程调试监控
远程调试监控必须以管理员身份运行,并且用户必须属于管理员组
在你运行监控时,会开启一个新的服务,该服务的名字必须用Visual Studio的Attach to Progress窗口的Qualifier组合框的值。

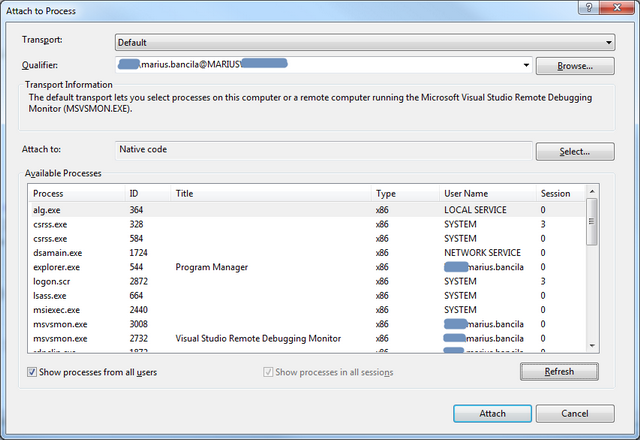
远程和本地机器上的防火墙必须允许Visual Studio和远程调试监控之间能够通信
想要调试,PDB文件是关键;为了能够让VisualStudio自动加载它们,必须满足以下条件:
1)本地的PDB文件必须可用(在远程机器的相同路径下放置一个对应的模块)。
2) 远程机器上的托管PDB文化必须可用。
结束语
Ivan Shcherbakov那篇文章和我这篇文章提到的调试技巧,在大多数的调试问题中都是必不可少的。
更多分享Visual Studio原生开发的10个调试技巧相关文章请关注PHP中文网!

Hot AI Tools

Undresser.AI Undress
AI-powered app for creating realistic nude photos

AI Clothes Remover
Online AI tool for removing clothes from photos.

Undress AI Tool
Undress images for free

Clothoff.io
AI clothes remover

Video Face Swap
Swap faces in any video effortlessly with our completely free AI face swap tool!

Hot Article

Hot Tools

Notepad++7.3.1
Easy-to-use and free code editor

SublimeText3 Chinese version
Chinese version, very easy to use

Zend Studio 13.0.1
Powerful PHP integrated development environment

Dreamweaver CS6
Visual web development tools

SublimeText3 Mac version
God-level code editing software (SublimeText3)

Hot Topics
 1664
1664
 14
14
 1422
1422
 52
52
 1316
1316
 25
25
 1267
1267
 29
29
 1239
1239
 24
24
 C# .NET: Exploring Core Concepts and Programming Fundamentals
Apr 10, 2025 am 09:32 AM
C# is a modern, object-oriented programming language developed by Microsoft and as part of the .NET framework. 1.C# supports object-oriented programming (OOP), including encapsulation, inheritance and polymorphism. 2. Asynchronous programming in C# is implemented through async and await keywords to improve application responsiveness. 3. Use LINQ to process data collections concisely. 4. Common errors include null reference exceptions and index out-of-range exceptions. Debugging skills include using a debugger and exception handling. 5. Performance optimization includes using StringBuilder and avoiding unnecessary packing and unboxing.
 Testing C# .NET Applications: Unit, Integration, and End-to-End Testing
Apr 09, 2025 am 12:04 AM
Testing strategies for C#.NET applications include unit testing, integration testing, and end-to-end testing. 1. Unit testing ensures that the minimum unit of the code works independently, using the MSTest, NUnit or xUnit framework. 2. Integrated tests verify the functions of multiple units combined, commonly used simulated data and external services. 3. End-to-end testing simulates the user's complete operation process, and Selenium is usually used for automated testing.
 The Continued Relevance of C# .NET: A Look at Current Usage
Apr 16, 2025 am 12:07 AM
C#.NET is still important because it provides powerful tools and libraries that support multiple application development. 1) C# combines .NET framework to make development efficient and convenient. 2) C#'s type safety and garbage collection mechanism enhance its advantages. 3) .NET provides a cross-platform running environment and rich APIs, improving development flexibility.
 From Web to Desktop: The Versatility of C# .NET
Apr 15, 2025 am 12:07 AM
C#.NETisversatileforbothwebanddesktopdevelopment.1)Forweb,useASP.NETfordynamicapplications.2)Fordesktop,employWindowsFormsorWPFforrichinterfaces.3)UseXamarinforcross-platformdevelopment,enablingcodesharingacrossWindows,macOS,Linux,andmobiledevices.
 C# as a Versatile .NET Language: Applications and Examples
Apr 26, 2025 am 12:26 AM
C# is widely used in enterprise-level applications, game development, mobile applications and web development. 1) In enterprise-level applications, C# is often used for ASP.NETCore to develop WebAPI. 2) In game development, C# is combined with the Unity engine to realize role control and other functions. 3) C# supports polymorphism and asynchronous programming to improve code flexibility and application performance.
 Is C# .NET Right for You? Evaluating its Applicability
Apr 13, 2025 am 12:03 AM
C#.NETissuitableforenterprise-levelapplicationswithintheMicrosoftecosystemduetoitsstrongtyping,richlibraries,androbustperformance.However,itmaynotbeidealforcross-platformdevelopmentorwhenrawspeediscritical,wherelanguageslikeRustorGomightbepreferable.
 C# Code within .NET: Exploring the Programming Process
Apr 12, 2025 am 12:02 AM
The programming process of C# in .NET includes the following steps: 1) writing C# code, 2) compiling into an intermediate language (IL), and 3) executing by the .NET runtime (CLR). The advantages of C# in .NET are its modern syntax, powerful type system and tight integration with the .NET framework, suitable for various development scenarios from desktop applications to web services.
 C# .NET and the Future: Adapting to New Technologies
Apr 14, 2025 am 12:06 AM
C# and .NET adapt to the needs of emerging technologies through continuous updates and optimizations. 1) C# 9.0 and .NET5 introduce record type and performance optimization. 2) .NETCore enhances cloud native and containerized support. 3) ASP.NETCore integrates with modern web technologies. 4) ML.NET supports machine learning and artificial intelligence. 5) Asynchronous programming and best practices improve performance.


