
 Backend-Entwicklung
Python-Tutorial
Überwachen Sie die Leistung Ihrer Python-Django-App mit AppSignal
Backend-Entwicklung
Python-Tutorial
Überwachen Sie die Leistung Ihrer Python-Django-App mit AppSignal
Überwachen Sie die Leistung Ihrer Python-Django-App mit AppSignal

Wenn wir ein langsames System beobachten, könnte unser erster Instinkt darin bestehen, es als versagend zu bezeichnen. Diese Annahme ist weit verbreitet und unterstreicht eine grundlegende Wahrheit: Leistung ist gleichbedeutend mit der Reife und Produktionsbereitschaft einer Anwendung.
Bei Webanwendungen, bei denen Millisekunden über Erfolg oder Misserfolg einer Benutzerinteraktion entscheiden können, steht unglaublich viel auf dem Spiel. Leistung ist nicht nur ein technischer Maßstab, sondern ein Eckpfeiler der Benutzerzufriedenheit und betrieblichen Effizienz.
Leistung fasst die Reaktionsfähigkeit eines Systems unter unterschiedlichen Arbeitslasten zusammen, quantifiziert durch Metriken wie CPU- und Speicherauslastung, Reaktionszeiten, Skalierbarkeit und Durchsatz.
In diesem Artikel werden wir untersuchen, wie AppSignal die Leistung von Django-Anwendungen überwachen und verbessern kann.
Lasst uns anfangen!
Grundlagen der Django-Leistungsüberwachung
Das Erreichen einer optimalen Leistung in Django-Anwendungen erfordert einen vielschichtigen Ansatz. Das bedeutet, Anwendungen zu entwickeln, die effizient laufen und ihre Effizienz auch bei der Skalierung beibehalten. Wichtige Kennzahlen sind in diesem Prozess von entscheidender Bedeutung und liefern greifbare Daten, die unsere Optimierungsbemühungen leiten. Lassen Sie uns einige dieser Kennzahlen untersuchen.
Schlüsselmetriken für die Leistungsüberwachung
- Reaktionszeit: Dies ist vielleicht der direkteste Indikator für die Benutzererfahrung. Es misst die Zeit, die für die Bearbeitung der Anfrage eines Benutzers und die Rücksendung der Antwort benötigt wird. In einer Django-Anwendung können Faktoren wie Datenbankabfragen, Ansichtsverarbeitung und Middleware-Operationen die Antwortzeiten beeinflussen.
- Durchsatz: Der Durchsatz bezieht sich auf die Anzahl der Anfragen, die Ihre Anwendung innerhalb eines bestimmten Zeitraums verarbeiten kann.
- Fehlerrate: Die Häufigkeit von Fehlern (4xx und 5xx HTTP-Antworten) kann auf Code-, Datenbankabfrage- oder Serverkonfigurationsprobleme hinweisen. Durch die Überwachung der Fehlerraten können Sie schnell Probleme identifizieren und beheben, die andernfalls die Benutzererfahrung beeinträchtigen könnten.
- Datenbankleistungsmetriken: Dazu gehören die Anzahl der Abfragen pro Anfrage, die Abfrageausführungszeit und die Effizienz von Datenbankverbindungen.
- Umgang mit gleichzeitigen Benutzern:Wenn mehrere Benutzer gleichzeitig auf Ihre Django-Anwendung zugreifen, ist es wichtig, alle Benutzer effizient und ohne Verzögerungen bedienen zu können.
Was wir bauen werden
In diesem Artikel erstellen wir einen Django-basierten E-Commerce-Shop, der für Ereignisse mit hohem Datenverkehr geeignet ist, und integrieren AppSignal, um ihn zu überwachen, zu optimieren und sicherzustellen, dass er unter Last nahtlos skaliert. Wir zeigen auch, wie Sie eine vorhandene Anwendung mit AppSignal für eine verbesserte Leistung erweitern können (in diesem Fall das Open edX-Lernmanagementsystem).
Projekt-Setup
Voraussetzungen
Um mitzumachen, benötigen Sie:
- Python 3.12.2
- Ein von AppSignal unterstütztes Betriebssystem
- Ein AppSignal-Konto
- Grundkenntnisse von Django
Bereiten Sie das Projekt vor
Jetzt erstellen wir ein Verzeichnis für unser Projekt und klonen es von GitHub. Wir installieren alle Anforderungen und führen eine Migration durch:
mkdir django-performance && cd django-performance
python3.12 -m venv venv
source venv/bin/activate
git clone -b main https://github.com/amirtds/mystore
cd mystore
python3.12 -m pip install -r requirements.txt
python3.12 manage.py migrate
python3.12 manage.py runserver
Besuchen Sie jetzt 127.0.0.1:8000. Sie sollten etwa Folgendes sehen:
Diese Django-Anwendung ist ein einfacher E-Commerce-Shop, der Produktlisten, Details und eine Checkout-Seite für Benutzer bereitstellt. Nachdem Sie die App erfolgreich geklont und installiert haben, verwenden Sie den Django-Verwaltungsbefehl createsuperuser, um einen Superuser zu erstellen.
Jetzt erstellen wir ein paar Produkte in unserer Anwendung. Zuerst rufen wir unsere Django-Anwendung auf, indem wir Folgendes ausführen:
python3.12 manage.py shell
Erstellen Sie 3 Kategorien und 3 Produkte:
from store.models import Category, Product

# Create categories
electronics = Category(name='Electronics', description='Gadgets and electronic devices.')
books = Category(name='Books', description='Read the world.')
clothing = Category(name='Clothing', description='Latest fashion and trends.')

# Save categories to the database
electronics.save()
books.save()
clothing.save()

# Now let's create new Products with slugs and image URLs
Product.objects.create(
    category=electronics,
    name='Smartphone',
    description='Latest model with high-end specs.',
    price=799.99,
    stock=30,
    available=True,
    slug='smartphone',
    image='products/iphone_14_pro_max.png'
)

Product.objects.create(
    category=books,
    name='Python Programming',
    description='Learn Python programming with this comprehensive guide.',
    price=39.99,
    stock=50,
    available=True,
    slug='python-programming',
    image='products/python_programming_book.png'
)

Product.objects.create(
    category=clothing,
    name='Jeans',
    description='Comfortable and stylish jeans for everyday wear.',
    price=49.99,
    stock=20,
    available=True,
    slug='jeans',
    image='products/jeans.png'
)
Schließen Sie nun die Shell und starten Sie den Server. Sie sollten etwa Folgendes sehen:

Installieren Sie AppSignal
Wir werden AppSignal und opentelemetry-instrumentation-django in unserem Projekt installieren.
Bevor Sie diese Pakete installieren, melden Sie sich mit Ihren Anmeldeinformationen bei AppSignal an (Sie können sich für eine kostenlose 30-Tage-Testversion anmelden). Nachdem Sie eine Organisation ausgewählt haben, klicken Sie oben rechts in der Navigationsleiste auf App hinzufügen. Wählen Sie Python als Sprache und Sie erhalten einen Push-API-Key.
Stellen Sie sicher, dass Ihre virtuelle Umgebung aktiviert ist, und führen Sie die folgenden Befehle aus:
python3.12 -m pip install appsignal==1.2.1
python3.12 -m appsignal install --push-api-key [YOU-KEY]
python3.12 -m pip install opentelemetry-instrumentation-django==0.45b0
Geben Sie den App-Namen an der CLI-Eingabeaufforderung an. Nach der Installation sollte in Ihrem Projekt eine neue Datei mit dem Namen __appsignal__.py angezeigt werden.
Now let's create a new file called .env in the project root and add APPSIGNAL_PUSH_API_KEY=YOUR-KEY (remember to change the value to your actual key). Then, let's change the content of the __appsignal__.py file to the following:
# __appsignal__.py
import os
from appsignal import Appsignal

# Load environment variables from the .env file
from dotenv import load_dotenv
load_dotenv()

# Get APPSIGNAL_PUSH_API_KEY from environment
push_api_key = os.getenv('APPSIGNAL_PUSH_API_KEY')

appsignal = Appsignal(
    active=True,
    name="mystore",
    push_api_key=os.getenv("APPSIGNAL_PUSH_API_KEY"),
)
Next, update the manage.py file to read like this:
# manage.py
#!/usr/bin/env python
"""Django's command-line utility for administrative tasks."""
import os
import sys

# import appsignal
from __appsignal__ import appsignal # new line


def main():
    """Run administrative tasks."""
    os.environ.setdefault("DJANGO_SETTINGS_MODULE", "mystore.settings")

    # Start Appsignal
    appsignal.start() # new line

    try:
        from django.core.management import execute_from_command_line
    except ImportError as exc:
        raise ImportError(
            "Couldn't import Django. Are you sure it's installed and "
            "available on your PYTHONPATH environment variable? Did you "
            "forget to activate a virtual environment?"
        ) from exc
    execute_from_command_line(sys.argv)


if __name__ == "__main__":
    main()
We've imported AppSignal and started it using the configuration from __appsignal.py.
Please note that the changes we made to manage.py are for a development environment. In production, we should change wsgi.py or asgi.py. For more information, visit AppSignal's Django documentation.
Project Scenario: Optimizing for a New Year Sale and Monitoring Concurrent Users
As we approach the New Year sales on our Django-based e-commerce platform, we recall last year's challenges: increased traffic led to slow load times and even some downtime. This year, we aim to avoid these issues by thoroughly testing and optimizing our site beforehand. We'll use Locust to simulate user traffic and AppSignal to monitor our application's performance.
Creating a Locust Test for Simulated Traffic
First, we'll create a locustfile.py file that simulates simultaneous users navigating through critical parts of our site: the homepage, a product detail page, and the checkout page. This simulation helps us understand how our site performs under pressure.
Create the locustfile.py in the project root:
# locustfile.py
from locust import HttpUser, between, task

class WebsiteUser(HttpUser):
    wait_time = between(1, 3)  # Users wait 1-3 seconds between tasks

    @task
    def index_page(self):
        self.client.get("/store/")

    @task(3)
    def view_product_detail(self):
        self.client.get("/store/product/smartphone/")

    @task(2)
    def view_checkout_page(self):
        self.client.get("/store/checkout/smartphone/")
In locustfile.py, users primarily visit the product detail page, followed by the checkout page, and occasionally return to the homepage. This pattern aims to mimic realistic user behavior during a sale.
Before running Locust, ensure you have a product with the smartphone slug in the Django app. If you don't, go to /admin/store/product/ and create one.
Defining Acceptable Response Times
Before we start, let's define what we consider an acceptable response time. For a smooth user experience, we aim for:
- Homepage and product detail pages: under 1 second.
- Checkout page: under 1.5 seconds (due to typically higher complexity).
These targets ensure users experience minimal delay, keeping their engagement high.
Conducting the Test and Monitoring Results
With our Locust test ready, we run it to simulate the 500 users and observe the results in real time. Here's how:
- Start the Locust test by running locust -f locustfile.py in your terminal, then open http://localhost:8089 to set up and start the simulation. Set the Number of Users to 500 and set the host to http://127.0.0.1:8000
- Monitor performance in both Locust's web interface and AppSignal. Locust shows us request rates and response times, while AppSignal provides deeper insights into our Django app's behavior under load.
After running Locust, you can find information about the load test in its dashboard:

Now, go to your application page in AppSignal. Under the Performance section, click on Actions and you should see something like this:
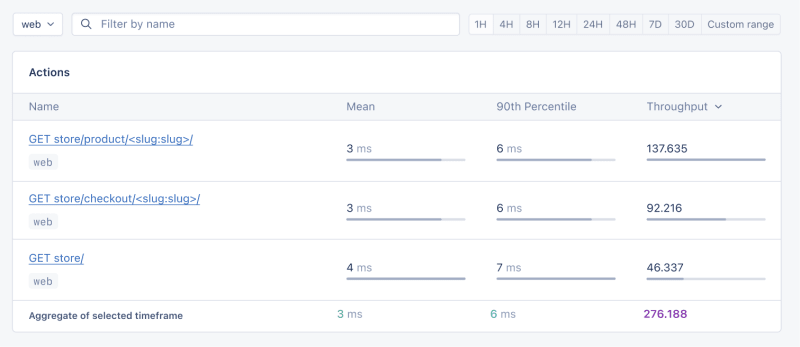
- Mean: This is the average response time for all the requests made to a particular endpoint. It provides a general idea of how long it takes for the server to respond. In our context, any mean response time greater than 1 second could be considered a red flag, indicating that our application's performance might not meet user expectations for speed.
- 90th Percentile: This is the response time at the 90th percentile. For example, for GET store/, we have 7 ms, which means 90% of requests are completed in 7 ms or less.
- Throughput: The number of requests handled per second.
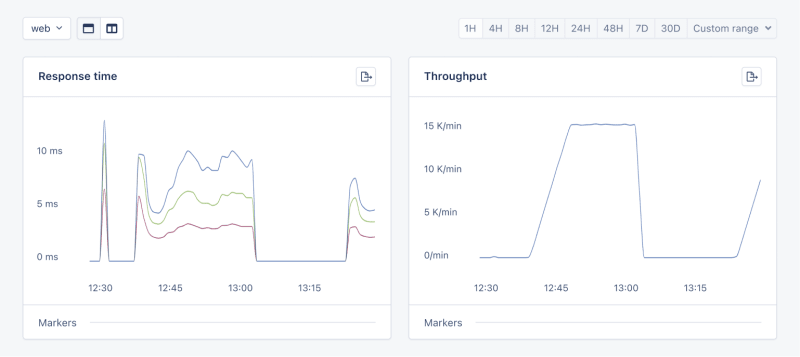
Now let's click on the Graphs under Performance:
We need to prepare our site for the New Year sales, as response times might exceed our targets. Here's a simplified plan:
- Database Queries: Slow queries often cause performance issues.
- Static Assets: Ensure static assets are properly cached. Use a CDN for better delivery speeds.
- Application Resources: Sometimes, the solution is as straightforward as adding more RAM and CPUs.
Database Operations
Understanding Database Performance Impact
When it comes to web applications, one of the most common sources of slow performance is database queries. Every time a user performs an action that requires data retrieval or manipulation, a query is made to the database.
If these queries are not well-optimized, they can take a considerable amount of time to execute, leading to a sluggish user experience. That's why it's crucial to monitor and optimize our queries, ensuring they're efficient and don't become the bottleneck in our application's performance.
Instrumentation and Spans
Before diving into the implementation, let's clarify two key concepts in performance monitoring:
- Instrumentation
- Spans
Instrumentation is the process of augmenting code to measure its performance and behavior during execution. Think of it like fitting your car with a dashboard that tells you not just the speed, but also the engine's performance, fuel efficiency, and other diagnostics while you drive.
Spans, on the other hand, are the specific segments of time measured by instrumentation. In our car analogy, a span would be the time taken for a specific part of your journey, like from your home to the highway. In the context of web applications, a span could represent the time taken to execute a database query, process a request, or complete any other discrete operation.
Instrumentation helps us create a series of spans that together form a detailed timeline of how a request is handled. This timeline is invaluable for pinpointing where delays occur and understanding the overall flow of a request through our system.
Implementing Instrumentation in Our Code
With our PurchaseProductView, we're particularly interested in the database interactions that create customer records and process purchases. By adding instrumentation to this view, we'll be able to measure these interactions and get actionable data on their performance.
Here's how we integrate AppSignal's custom instrumentation into our Django view:
# store/views.py
# Import OpenTelemetry's trace module for creating custom spans
from opentelemetry import trace
# Import AppSignal's set_root_name for customizing the trace name
from appsignal import set_root_name

# Inside the PurchaseProductView
def post(self, request, *args, **kwargs):
    # Initialize the tracer for this view
    tracer = trace.get_tracer(__name__)

    # Start a new span for the view using 'with' statement
    with tracer.start_as_current_span("PurchaseProductView"):
        # Customize the name of the trace to be more descriptive
        set_root_name("POST /store/purchase/<slug>")

        # ... existing code to handle the purchase ...

        # Start another span to monitor the database query performance
        with tracer.start_as_current_span("Database Query - Retrieve or Create Customer"):
            # ... code to retrieve or create a customer ...

            # Yet another span to monitor the purchase record creation
            with tracer.start_as_current_span("Database Query - Create Purchase Record"):
                # ... code to create a purchase record ...
See the full code of the view after the modification.
In this updated view, custom instrumentation is added to measure the performance of database queries when retrieving or creating a customer and creating a purchase record.
Now, after purchasing a product in the Slow events section of the Performance dashboard, you should see the purchase event, its performance, and how long it takes to run the query.

purchase is the event we added to our view.
Using AppSignal with an Existing Django App
In this section, we are going to see how we can integrate AppSignal with Open edX, an open-source learning management system based on Python and Django.
Monitoring the performance of learning platforms like Open edX is highly important, since a slow experience directly impacts students' engagement with learning materials and can have a negative impact (for example, a high number of users might decide not to continue with a course).
Integrate AppSignal
Here, we can follow similar steps as the Project Setup section. However, for Open edX, we will follow Production Setup and initiate AppSignal in wsgi.py. Check out this commit to install and integrate AppSignal with Open edX.
Monitor Open edX Performance
Now we'll interact with our platform and see the performance result in the dashboard.
Let's register a user, log in, enroll them in multiple courses, and interact with the course content.
Actions
Going to Actions, let's order the actions based on their mean time and find slow events:
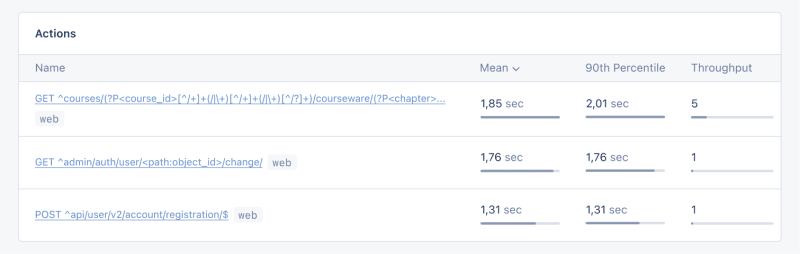
As we can see, for 3 events (out of the 34 events we tested) the response time is higher than 1 second.
Host Metrics
Host Metrics in AppSignal show resource usage:

Unser System ist nicht stark ausgelastet – der Auslastungsdurchschnitt liegt bei 0,03 – aber die Speichernutzung ist hoch.
Wir können auch einen Auslöser hinzufügen, um eine Benachrichtigung zu erhalten, wenn die Ressourcennutzung einen bestimmten Zustand erreicht. Beispielsweise können wir einen Auslöser festlegen, wenn die Speichernutzung über 80 % steigt, um benachrichtigt zu werden und Ausfälle zu verhindern.

Wenn wir die Bedingung erfüllen, sollten Sie eine Benachrichtigung wie die folgende erhalten:

Überwachung von Sellerie-Aufgaben
In Open edX verwenden wir Celery für asynchrone und lang andauernde Aufgaben wie Zertifikatserstellung, Bewertung und Massen-E-Mail-Funktionalität.
Abhängig von der Aufgabe und der Anzahl der Benutzer können einige dieser Aufgaben über einen längeren Zeitraum ausgeführt werden und zu Leistungsproblemen auf unserer Plattform führen.
Wenn beispielsweise Tausende von Benutzern für einen Kurs angemeldet sind und wir sie neu bewerten müssen, kann diese Aufgabe eine Weile dauern. Wir erhalten möglicherweise Beschwerden von Benutzern, dass ihre Note nicht im Dashboard angezeigt wird, weil die Aufgabe noch ausgeführt wird. Informationen zu Celery-Aufgaben, ihrer Laufzeit und ihrer Ressourcennutzung geben uns wichtige Erkenntnisse und mögliche Verbesserungspunkte für unsere Anwendung.
Lassen Sie uns AppSignal verwenden, um unsere Celery-Aufgaben in Open edX zu verfolgen und das Ergebnis im Dashboard zu sehen. Stellen Sie zunächst sicher, dass die erforderlichen Anforderungen installiert sind. Als nächstes legen wir unsere Aufgaben so fest, dass sie die Leistung von Sellerie verfolgen, wie in diesem Commit.
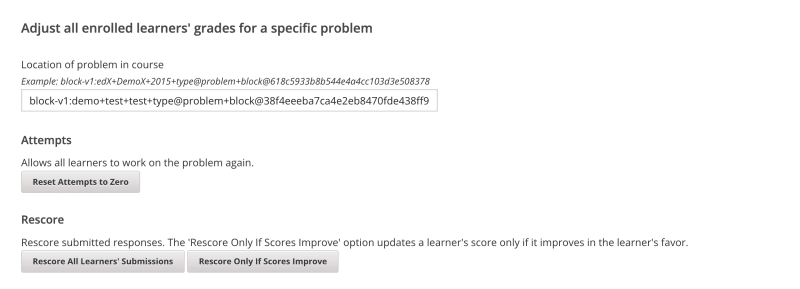
Lassen Sie uns nun ein paar Aufgaben im Open edX-Dashboard ausführen, um Versuche zurückzusetzen und die Beiträge der Lernenden neu zu bewerten:
Wir gehen zum Dashboard Leistung in AppSignal -> Langsame Ereignisse und wir werden etwas sehen wie:
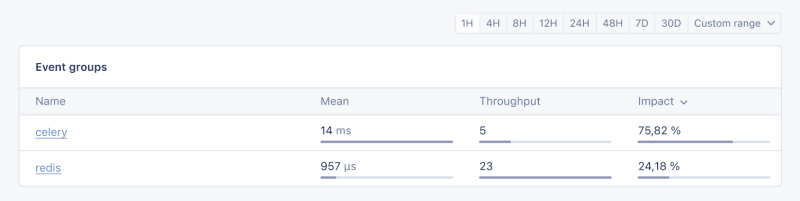
Wenn wir auf Celery klicken, sehen wir alle Aufgaben, die auf Open edX ausgeführt wurden:

Das sind großartige Informationen, die uns helfen zu erkennen, ob unsere Aufgaben länger als erwartet laufen, damit wir mögliche Leistungsengpässe beheben können.
Und das ist es!
Zusammenfassung
In diesem Artikel haben wir gesehen, wie AppSignal uns Einblicke in die Leistung unserer Django-App geben kann.
Wir haben eine einfache E-Commerce-Django-Anwendung überwacht, einschließlich Metriken wie gleichzeitige Benutzer, Datenbankabfragen und Antwortzeit.
Als Fallstudie haben wir AppSignal mit Open edX integriert und gezeigt, wie die Leistungsüberwachung zur Verbesserung des Benutzererlebnisses beitragen kann, insbesondere für Studenten, die die Plattform nutzen.
Viel Spaß beim Codieren!
P.S. Wenn Sie Python-Beiträge lesen möchten, sobald sie veröffentlicht werden, abonnieren Sie unseren Python Wizardry-Newsletter und verpassen Sie keinen einzigen Beitrag!
Das obige ist der detaillierte Inhalt vonÜberwachen Sie die Leistung Ihrer Python-Django-App mit AppSignal. Für weitere Informationen folgen Sie bitte anderen verwandten Artikeln auf der PHP chinesischen Website!

Heiße KI -Werkzeuge

Undresser.AI Undress
KI-gestützte App zum Erstellen realistischer Aktfotos

AI Clothes Remover
Online-KI-Tool zum Entfernen von Kleidung aus Fotos.

Undress AI Tool
Ausziehbilder kostenlos

Clothoff.io
KI-Kleiderentferner

Video Face Swap
Tauschen Sie Gesichter in jedem Video mühelos mit unserem völlig kostenlosen KI-Gesichtstausch-Tool aus!

Heißer Artikel
Heiße Werkzeuge

Notepad++7.3.1
Einfach zu bedienender und kostenloser Code-Editor

SublimeText3 chinesische Version
Chinesische Version, sehr einfach zu bedienen

Senden Sie Studio 13.0.1
Leistungsstarke integrierte PHP-Entwicklungsumgebung

Dreamweaver CS6
Visuelle Webentwicklungstools

SublimeText3 Mac-Version
Codebearbeitungssoftware auf Gottesniveau (SublimeText3)
Heiße Themen
 1668
1668
 14
1428
52
1329
25
1273
29
1256
24
14
1428
52
1329
25
1273
29
1256
24

 Python: Spiele, GUIs und mehr
Apr 13, 2025 am 12:14 AM
Python: Spiele, GUIs und mehr
Apr 13, 2025 am 12:14 AM
Python zeichnet sich in Gaming und GUI -Entwicklung aus. 1) Spielentwicklung verwendet Pygame, die Zeichnungen, Audio- und andere Funktionen bereitstellt, die für die Erstellung von 2D -Spielen geeignet sind. 2) Die GUI -Entwicklung kann Tkinter oder Pyqt auswählen. Tkinter ist einfach und einfach zu bedienen. PYQT hat reichhaltige Funktionen und ist für die berufliche Entwicklung geeignet.
 Python vs. C: Lernkurven und Benutzerfreundlichkeit
Apr 19, 2025 am 12:20 AM
Python vs. C: Lernkurven und Benutzerfreundlichkeit
Apr 19, 2025 am 12:20 AM
Python ist leichter zu lernen und zu verwenden, während C leistungsfähiger, aber komplexer ist. 1. Python -Syntax ist prägnant und für Anfänger geeignet. Durch die dynamische Tippen und die automatische Speicherverwaltung können Sie die Verwendung einfach zu verwenden, kann jedoch zur Laufzeitfehler führen. 2.C bietet Steuerung und erweiterte Funktionen auf niedrigem Niveau, geeignet für Hochleistungsanwendungen, hat jedoch einen hohen Lernschwellenwert und erfordert manuellem Speicher und Typensicherheitsmanagement.
 Python und Zeit: Machen Sie das Beste aus Ihrer Studienzeit
Apr 14, 2025 am 12:02 AM
Python und Zeit: Machen Sie das Beste aus Ihrer Studienzeit
Apr 14, 2025 am 12:02 AM
Um die Effizienz des Lernens von Python in einer begrenzten Zeit zu maximieren, können Sie Pythons DateTime-, Zeit- und Zeitplanmodule verwenden. 1. Das DateTime -Modul wird verwendet, um die Lernzeit aufzuzeichnen und zu planen. 2. Das Zeitmodul hilft, die Studie zu setzen und Zeit zu ruhen. 3. Das Zeitplanmodul arrangiert automatisch wöchentliche Lernaufgaben.
 Python vs. C: Erforschung von Leistung und Effizienz erforschen
Apr 18, 2025 am 12:20 AM
Python vs. C: Erforschung von Leistung und Effizienz erforschen
Apr 18, 2025 am 12:20 AM
Python ist in der Entwicklungseffizienz besser als C, aber C ist in der Ausführungsleistung höher. 1. Pythons prägnante Syntax und reiche Bibliotheken verbessern die Entwicklungseffizienz. 2. Die Kompilierungsmerkmale von Compilation und die Hardwarekontrolle verbessern die Ausführungsleistung. Bei einer Auswahl müssen Sie die Entwicklungsgeschwindigkeit und die Ausführungseffizienz basierend auf den Projektanforderungen abwägen.
 Welches ist Teil der Python Standard Library: Listen oder Arrays?
Apr 27, 2025 am 12:03 AM
Welches ist Teil der Python Standard Library: Listen oder Arrays?
Apr 27, 2025 am 12:03 AM
PythonlistsarePartThestandardlibrary, whilearraysarenot.listarebuilt-in, vielseitig und UNDUSEDFORSPORINGECollections, während dieArrayRay-thearrayModulei und loses und loses und losesaluseduetolimitedFunctionality.
 Python lernen: Ist 2 Stunden tägliches Studium ausreichend?
Apr 18, 2025 am 12:22 AM
Python lernen: Ist 2 Stunden tägliches Studium ausreichend?
Apr 18, 2025 am 12:22 AM
Ist es genug, um Python für zwei Stunden am Tag zu lernen? Es hängt von Ihren Zielen und Lernmethoden ab. 1) Entwickeln Sie einen klaren Lernplan, 2) Wählen Sie geeignete Lernressourcen und -methoden aus, 3) praktizieren und prüfen und konsolidieren Sie praktische Praxis und Überprüfung und konsolidieren Sie und Sie können die Grundkenntnisse und die erweiterten Funktionen von Python während dieser Zeit nach und nach beherrschen.
 Python: Automatisierung, Skript- und Aufgabenverwaltung
Apr 16, 2025 am 12:14 AM
Python: Automatisierung, Skript- und Aufgabenverwaltung
Apr 16, 2025 am 12:14 AM
Python zeichnet sich in Automatisierung, Skript und Aufgabenverwaltung aus. 1) Automatisierung: Die Sicherungssicherung wird durch Standardbibliotheken wie OS und Shutil realisiert. 2) Skriptschreiben: Verwenden Sie die PSUTIL -Bibliothek, um die Systemressourcen zu überwachen. 3) Aufgabenverwaltung: Verwenden Sie die Zeitplanbibliothek, um Aufgaben zu planen. Die Benutzerfreundlichkeit von Python und die Unterstützung der reichhaltigen Bibliothek machen es zum bevorzugten Werkzeug in diesen Bereichen.
 Python vs. C: Verständnis der wichtigsten Unterschiede
Apr 21, 2025 am 12:18 AM
Python vs. C: Verständnis der wichtigsten Unterschiede
Apr 21, 2025 am 12:18 AM
Python und C haben jeweils ihre eigenen Vorteile, und die Wahl sollte auf Projektanforderungen beruhen. 1) Python ist aufgrund seiner prägnanten Syntax und der dynamischen Typisierung für die schnelle Entwicklung und Datenverarbeitung geeignet. 2) C ist aufgrund seiner statischen Tipp- und manuellen Speicherverwaltung für hohe Leistung und Systemprogrammierung geeignet.
