

Excel GroupBy -Funktion für Gruppenreihen und aggregierte Werte

Unlock the Power of Excel's GROUPBY Function for Enhanced Data Analysis! This function simplifies data grouping, summarization, sorting, and filtering, all within a single formula. Say goodbye to complex outlines, subtotals, and pivot tables – GROUPBY streamlines your workflow.
Excel's data analysis capabilities just got a significant boost. While features like outlines and pivot tables have long been staples for organizing and interpreting data, the new GROUPBY function offers a more streamlined approach, all within the convenience of your formula bar.
- Understanding the Excel GROUPBY Function: Syntax and Basic Applications
- GROUPBY Function Availability and Compatibility
- Constructing a Basic GROUPBY Formula
- Mastering GROUPBY: Advanced Formula Examples
- Selecting the Right Aggregation Function
- Displaying Headers Effectively
- Grouping Rows Using Multiple Columns
- Grouping with Non-Adjacent Columns
- Controlling the Display of Totals and Subtotals
- Sorting Grouped Data
- Filtering Results
- Aggregating Multiple Columns (Adjacent and Non-Adjacent)
- Multiple Aggregations on a Single Dataset
- Handling Comma-Separated Text Strings
- Auto-Formatting GROUPBY Results with Conditional Formatting
- Troubleshooting GROUPBY Function Issues
The Excel GROUPBY Function
The GROUPBY function efficiently groups and aggregates data rows based on values in one or more columns. It also supports sorting and filtering of grouped data. As a dynamic array function, it returns multiple results, spilling into adjacent cells. The output resembles a pivot table without the formatting; the spill range dynamically recalculates with data changes. This is particularly beneficial for large datasets requiring summarized data through functions like SUM, AVERAGE, or COUNT.

Note: GROUPBY is similar to PIVOTBY, but GROUPBY exclusively groups data in rows.
Function Syntax
GROUPBY(row_fields, values, function, [field_headers], [total_depth], [sort_order], [filter_array])
Seven arguments are available, but only the first three are mandatory:
-
row_fields(required): The range of values to group by. -
values(required): The values to aggregate. -
function(required): The aggregation function (e.g.,SUM,AVERAGE,COUNT,MIN,MAX). -
field_headers(optional): Controls header display (0: No headers, 1: Yes, but don't show, 2: No headers, but generate, 3: Yes, and show). -
total_depth(optional): Controls total/subtotal display (0: No totals, 1: Grand total at bottom, 2: Grand and subtotals at bottom, -1: Grand total at top, -2: Grand and subtotals at top). -
sort_order(optional): Sorts by column index (positive for ascending, negative for descending). Arrays allow multi-column sorting. -
filter_array(optional): Filters rows using a Boolean array.
Usage Tips
- Dynamic Updates: The formula dynamically adjusts to dataset changes within its range. Adding new rows requires including them in the argument ranges or using an Excel table for automatic expansion.
-
Header Detection: If
field_headersis omitted, Excel infers headers based on thevaluesargument (text followed by a number suggests headers). -
Range Consistency:
row_fieldsandvaluesmust have equal lengths to avoid#VALUE!errors. - Conditional Formatting: Enhance readability by using conditional formatting to highlight totals and subtotals.
Note: GROUPBY is under development; thorough testing is recommended.
GROUPBY Function Availability
Currently available in Excel for Microsoft 365 (Insider Beta Channel).
Basic GROUPBY Formula
Let's assume a dataset with project names (Column A), types (Column B), and revenues (Column C). To summarize revenues by project type:
=GROUPBY(B2:B32, C2:C32, SUM)
This yields a list of unique project types with their revenue sums. Defaults are used for optional arguments (no headers, ascending sort, grand total at bottom).

Advanced GROUPBY Formula Examples
This section expands on the basic example, demonstrating the function's versatility.
Choosing the Aggregation Function
GROUPBY supports 16 aggregation functions, including standard functions (SUM, AVERAGE, COUNT, etc.) and specialized ones (PERCENTOF, ARRAYTOTEXT). These are eta-reduced lambdas, simplifying usage. Custom lambda functions are also supported. Multiple aggregations are possible using vectors (vertical for column stacking, horizontal for row stacking).
Displaying Headers
Use the field_headers argument (set to 3) to include headers in the output.
=GROUPBY(B2:B32, C2:C32, SUM, 3)

Grouping by Multiple Columns
Include a multi-column range in row_fields to group by multiple columns. For example, grouping by project type and status:
=GROUPBY(B2:C32, D2:D32, COUNT)

Grouping by Non-Adjacent Columns
Use CHOOSECOLS to select non-adjacent columns for grouping:
=GROUPBY(CHOOSECOLS(A2:D32, 2, 4), C2:C32, COUNT)

Controlling Totals and Subtotals
Use total_depth to control total/subtotal display. Setting it to 2 shows both grand and subtotals.
=GROUPBY(B2:C32, D2:D32, SUM, 3, 2)

Sorting Grouped Rows
Use sort_order for custom sorting (positive for ascending, negative for descending). Arrays enable multi-column sorting.
=GROUPBY(B2:B32, C2:C32, SUM, , , 2) (Sorts by values)

=GROUPBY(B2:C32, D2:D32, SUM, , , {-1,2}) (Multi-column sort)

Filtering Results
Use filter_array (Boolean array) to filter rows.
=GROUPBY(B2:B32, C2:C32, SUM, , , , B2:B32<>"Design")

Aggregating Multiple Columns
Aggregate adjacent columns directly:
=GROUPBY(B2:B32, D2:E32, AVERAGE, 3)

For non-adjacent columns, use CHOOSECOLS:
=GROUPBY(B2:B32, CHOOSECOLS(C2:E32, 1, 3), AVERAGE, 3)

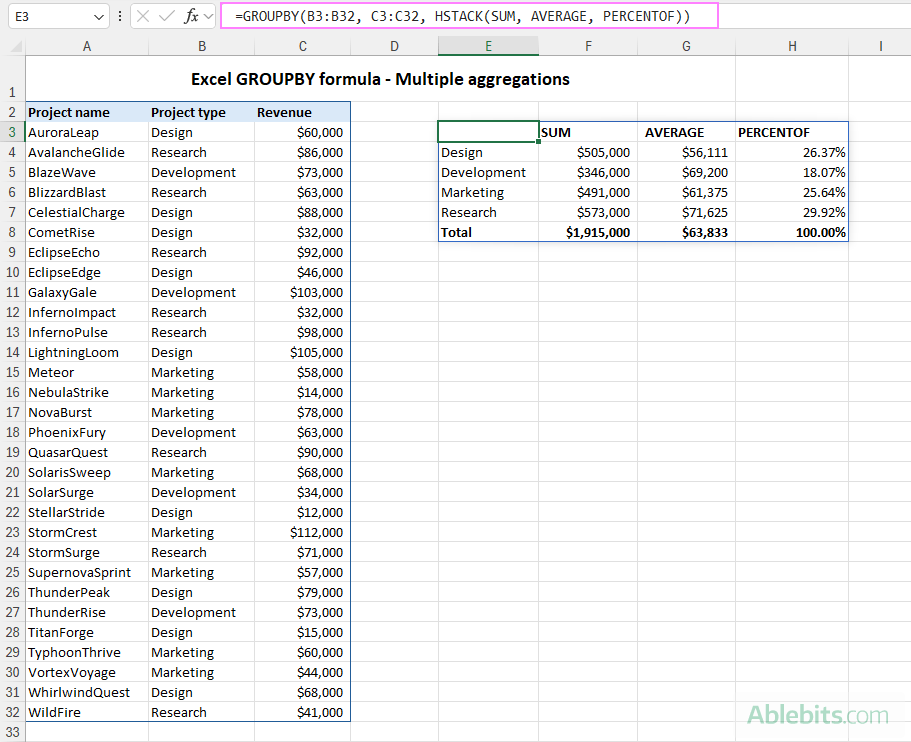
Multiple Aggregations on the Same Data
Use HSTACK or VSTACK for multiple aggregations:
=GROUPBY(B3:B32, C3:C32, HSTACK(SUM, AVERAGE, PERCENTOF))
=GROUPBY(B3:B32, C3:C32, VSTACK(SUM, AVERAGE, MIN, MAX),, 0)

Grouping Comma-Separated Text Values
Use ARRAYTOTEXT to group comma-separated text:
=GROUPBY(B3:B23, A3:A23, ARRAYTOTEXT, 0, 0)

Conditional Formatting of GROUPBY Results
Enhance visual clarity using conditional formatting to highlight headers, totals, and subtotals.
Troubleshooting GROUPBY Function Issues
- Function Unavailability: Ensure you have a Microsoft 365 subscription and the latest updates.
-
#VALUE!Error: Check for equal lengths inrow_fieldsandvaluesarguments, and ensure correctfilter_arraylength. Also, verify thattotal_depthis appropriate for the number of columns inrow_fields. -
#SPILL!Error: Clear adjacent cells to allow spill range.
In conclusion, the GROUPBY function significantly enhances Excel's data analysis capabilities, providing a powerful and efficient tool for various data manipulation tasks. With practice, you'll unlock its full potential for insightful data analysis.
Das obige ist der detaillierte Inhalt vonExcel GroupBy -Funktion für Gruppenreihen und aggregierte Werte. Für weitere Informationen folgen Sie bitte anderen verwandten Artikeln auf der PHP chinesischen Website!

Heiße KI -Werkzeuge

Undresser.AI Undress
KI-gestützte App zum Erstellen realistischer Aktfotos

AI Clothes Remover
Online-KI-Tool zum Entfernen von Kleidung aus Fotos.

Undress AI Tool
Ausziehbilder kostenlos

Clothoff.io
KI-Kleiderentferner

Video Face Swap
Tauschen Sie Gesichter in jedem Video mühelos mit unserem völlig kostenlosen KI-Gesichtstausch-Tool aus!

Heißer Artikel
Heiße Werkzeuge

Notepad++7.3.1
Einfach zu bedienender und kostenloser Code-Editor

SublimeText3 chinesische Version
Chinesische Version, sehr einfach zu bedienen

Senden Sie Studio 13.0.1
Leistungsstarke integrierte PHP-Entwicklungsumgebung

Dreamweaver CS6
Visuelle Webentwicklungstools

SublimeText3 Mac-Version
Codebearbeitungssoftware auf Gottesniveau (SublimeText3)
Heiße Themen


 Excel -Formel, um die Top 3, 5, 10 Werte in der Spalte oder Zeile zu finden
Apr 01, 2025 am 05:09 AM
Excel -Formel, um die Top 3, 5, 10 Werte in der Spalte oder Zeile zu finden
Apr 01, 2025 am 05:09 AM
In diesem Tutorial wird gezeigt, wie die Top -N -Werte in einem Datensatz effizient lokalisiert werden und zugehörige Daten mithilfe von Excel -Formeln abgerufen werden können. Unabhängig davon, ob Sie die höchsten, niedrigsten oder diejenigen, die spezifische Kriterien erfüllen, benötigen dieser Leitfaden Lösungen. Findi
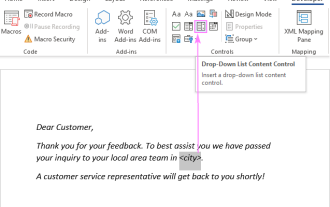 Fügen Sie der Outlook -E -Mail -Vorlage eine Dropdown -Liste hinzu
Apr 01, 2025 am 05:13 AM
Fügen Sie der Outlook -E -Mail -Vorlage eine Dropdown -Liste hinzu
Apr 01, 2025 am 05:13 AM
In diesem Tutorial wird angezeigt, wie Sie Ihren Outlook -E -Mail -Vorlagen Dropdown -Listen hinzufügen, einschließlich mehrerer Auswahl- und Datenbankpopulationen. Während Outlook Dropdowns nicht direkt unterstützt, bietet dieser Leitfaden kreative Problemumgehungen. E -Mail -Vorlagen SAV
 So verwenden Sie Flash -Füllung in Excel mit Beispielen
Apr 05, 2025 am 09:15 AM
So verwenden Sie Flash -Füllung in Excel mit Beispielen
Apr 05, 2025 am 09:15 AM
Dieses Tutorial bietet einen umfassenden Leitfaden zur Flash -Füllfunktion von Excel, einem leistungsstarken Tool zur Automatisierung von Dateneingabeaufgaben. Es deckt verschiedene Aspekte ab, von seiner Definition und seinem Standort bis hin zu fortgeschrittener Verwendung und Fehlerbehebung. Excels Fla verstehen
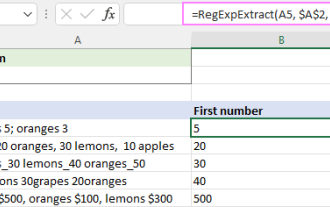 Regex, um Saiten in Excel zu extrahieren (eine oder alle Übereinstimmungen)
Mar 28, 2025 pm 12:19 PM
Regex, um Saiten in Excel zu extrahieren (eine oder alle Übereinstimmungen)
Mar 28, 2025 pm 12:19 PM
In diesem Tutorial lernen Sie, wie Sie reguläre Ausdrücke in Excel verwenden, um Substrings zu finden und zu extrahieren, die einem bestimmten Muster entsprechen. Microsoft Excel bietet eine Reihe von Funktionen, um Text aus Zellen zu extrahieren. Diese Funktionen können mit den meisten umgehen
 So fügen Sie Kalender zu Outlook hinzu: freigegebener, Internetkalender, iCal -Datei
Apr 03, 2025 am 09:06 AM
So fügen Sie Kalender zu Outlook hinzu: freigegebener, Internetkalender, iCal -Datei
Apr 03, 2025 am 09:06 AM
In diesem Artikel wird erläutert, wie Sie in der Outlook -Desktop -Anwendung freigegebene Kalender und die Nutzung gemeinsamer Kalender, einschließlich des Importierens von Icalendar -Dateien, zugreifen. Zuvor haben wir Ihren Outlook -Kalender geteilt. Lassen Sie uns nun untersuchen
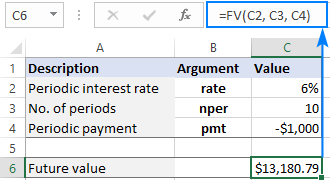 FV -Funktion in Excel, um den zukünftigen Wert zu berechnen
Apr 01, 2025 am 04:57 AM
FV -Funktion in Excel, um den zukünftigen Wert zu berechnen
Apr 01, 2025 am 04:57 AM
In diesem Tutorial wird erläutert, wie die FV-Funktion von Excel verwendet wird, um den zukünftigen Wert von Investitionen zu bestimmen und sowohl reguläre Zahlungen als auch Pauschalablagerungen zu umfassen. Effektive Finanzplanung hängt vom Verständnis des Investitionswachstums ab, und dieser Leitfaden prov
 Medianformel in Excel - Praktische Beispiele
Apr 11, 2025 pm 12:08 PM
Medianformel in Excel - Praktische Beispiele
Apr 11, 2025 pm 12:08 PM
In diesem Tutorial wird erläutert, wie der Median der numerischen Daten in Excel mithilfe der Medianfunktion berechnet wird. Der Median, ein wesentliches Maß für die zentrale Tendenz, identifiziert den mittleren Wert in einem Datensatz und bietet eine robustere Darstellung der zentralen Tendene
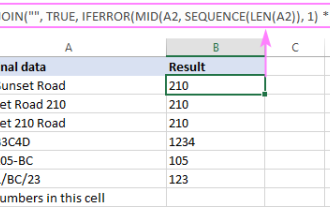 So entfernen / teilen Sie Text und Zahlen in Excel Cell
Apr 01, 2025 am 05:07 AM
So entfernen / teilen Sie Text und Zahlen in Excel Cell
Apr 01, 2025 am 05:07 AM
Dieses Tutorial zeigt verschiedene Methoden zur Trennung von Text und Zahlen in Excel-Zellen, wobei sowohl integrierte Funktionen als auch benutzerdefinierte VBA-Funktionen verwendet werden. Sie lernen, wie Sie Zahlen extrahieren, während Sie Text entfernen, Text isolieren, während Sie Zahlen wegwerfen
