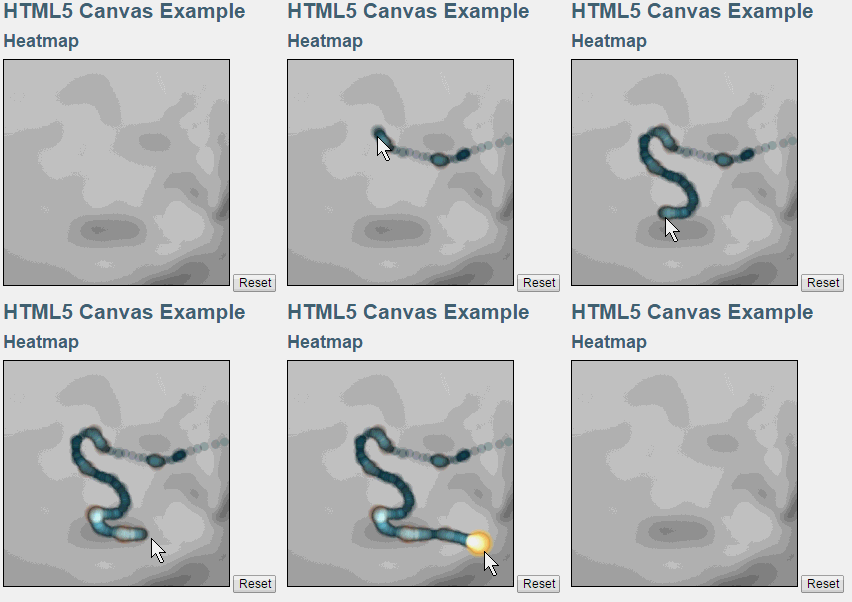
Mit der Canvas-API können Sie viele Anwendungen erstellen: Grafiken, Diagramme und Bildbearbeitung. Eine der wunderbarsten Anwendungen ist das Ändern oder Überschreiben vorhandener Inhalte. Die beliebteste Overlay-Karte heißt Heatmap. Heatmaps können auf Stadtplänen verwendet werden, um Verkehrsbedingungen zu markieren oder Sturmaktivitäten anzuzeigen.
Auf der Karte müssen Sie nur die Leinwand auf der Karte stapeln, um sie anzuzeigen. Tatsächlich wird die Karte mit einer Leinwand abgedeckt und dann basierend auf den entsprechenden Aktivitätsdaten unterschiedliche Wärmestufen gezeichnet.
Ein Beispiel finden Sie unten.
<!DOCTYPE html>
<html>
<title>HTML5 Canvas Example</title>
<style type="text/css">
@import url("styles.css");
#heatmap {
background-image: url("mapbg.jpg");
}
</style>
<h1>HTML5 Canvas Example</h1>
<h2>Heatmap </h2>
<canvas id="heatmap" class="clear" style="border: 1px solid ; " height="300" width="300"> </canvas>
<button id="resetButton">Reset</button>
<script>
function log() {
console.log(arguments);
}
var points = {};
var SCALE = 3;
var x = -1;
var y = -1;
function loadDemo() {
document.getElementById("resetButton").onclick = reset;
canvas = document.getElementById("heatmap");
context = canvas.getContext('2d');
context.globalAlpha = 0.2;
context.globalCompositeOperation = "lighter";
function sample() {
if (x != -1) {
addToPoint(x,y)
}
setTimeout(sample, 100);
}
canvas.onmousemove = function(e) {
x = e.clientX - e.target.offsetLeft;
y = e.clientY - e.target.offsetTop;
addToPoint(x,y)
}
sample();
}
function reset() {
points = {};
context.clearRect(0,0,300,300);
x = -1;
y = -1;
}
function getColor(intensity) {
var colors = ["#072933", "#2E4045", "#8C593B", "#B2814E", "#FAC268", "#FAD237"];
return colors[Math.floor(intensity/2)];
}
function drawPoint(x, y, radius) {
context.fillStyle= getColor(radius);
radius = Math.sqrt(radius)*6;
context.beginPath();
context.arc(x, y, radius, 0, Math.PI*2, true)
context.closePath();
context.fill();
}
function addToPoint(x, y) {
x = Math.floor(x/SCALE);
y= Math.floor(y/SCALE);
if (!points[[x,y]]) {
points[[x,y]] = 1;
} else if (points[[x,y]]==10) {
return
} else {
points[[x,y]]++;
}
drawPoint(x*SCALE,y*SCALE, points[[x,y]]);
}
window.addEventListener("load", loadDemo, true);
</script>
</html>
Das Obige ist der Inhalt von HTML5 10 __Verwenden Sie die Canvas-API, um eine „Heatmap“ zu erstellen Bitte achten Sie auf die chinesische PHP-Website (www.php.cn)!
 Was sind die Produktionsmethoden der HTML5-Animationsproduktion?
 Der Unterschied zwischen HTML und HTML5
 So deaktivieren Sie die ICS-Netzwerkfreigabe
 Worauf bezieht sich „Schreiben' in Python?
 So öffnen Sie eine OFD-Datei
 location.reload-Nutzung
 So registrieren Sie ein Bitcoin-Wallet
 So verwenden Sie die Plotfunktion in Python


