 Web-Frontend
 js-Tutorial
 Ausführliche Erklärung des xCharts-D3-basierten JavaScript-Diagrammbibliothekscodes (Bild)
Ausführliche Erklärung des xCharts-D3-basierten JavaScript-Diagrammbibliothekscodes (Bild)
xCharts-D3-basiertes JavaScript Details zum Diagrammbibliothekscode (Bild)
xCharts ist eine auf D3 basierende JavaScript-Diagrammbibliothek. Sie unterstützt nicht nur mehrere Diagrammtypen, sondern verfügt auch über umfangreiche Diagrammdesignstile und ist sehr schön. Darüber hinaus ist das Design von xCharts sehr flexibel, die Konfiguration relativ einfach und die Ladegeschwindigkeit ist nicht schlecht. Es handelt sich um eine JavaScript-Diagrammanwendung, die sehr offen und anpassbar ist.
Funktionen von xCharts
basiert auf JavaScript und kann daher verwendet werden, solange Sie über einen Browser verfügen und die Plattformkompatibilität gut ist.
Offen und anpassbar, daher ist die Konfiguration recht flexibel.
unterstützt das SVG-Format, sodass Diagrammdaten auch problemlos exportiert werden können.
Verwendung von xCharts
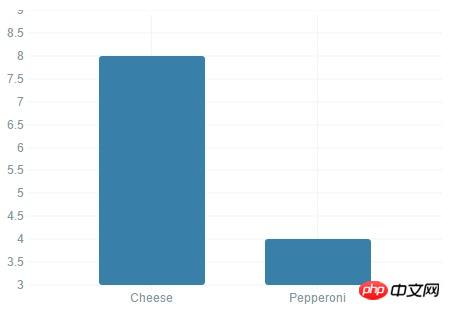
Einfaches Säulendiagramm
JavaScript-Code:
var data = {
  "xScale": "ordinal",
  "yScale": "linear",
  "main": [
    {
      "className": ".pizza",
      "data": [
        {
          "x": "Pepperoni",
          "y": 4
        },
        {
          "x": "Cheese",
          "y": 8
        }
      ]
    }
  ]
};
var myChart = new xChart('bar', data, '#example1');Rendering:

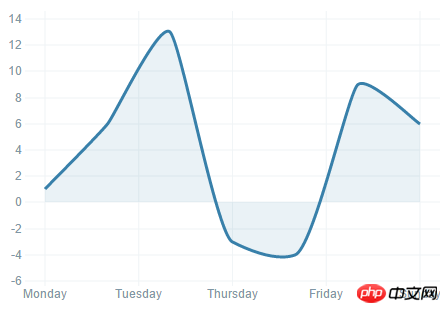
Linearer Graph
JavaScript-Code:
var data = {
  "xScale": "time",
  "yScale": "linear",
  "type": "line",
  "main": [
    {
      "className": ".pizza",
      "data": [
        {
          "x": "2012-11-05",
          "y": 1
        },
        {
          "x": "2012-11-06",
          "y": 6
        },
        {
          "x": "2012-11-07",
          "y": 13
        },
        {
          "x": "2012-11-08",
          "y": -3
        },
        {
          "x": "2012-11-09",
          "y": -4
        },
        {
          "x": "2012-11-10",
          "y": 9
        },
        {
          "x": "2012-11-11",
          "y": 6
        }
      ]
    }
  ]
};
var opts = {
  "dataFormatX": function (x) { return d3.time.format('%Y-%m-%d').parse(x); },
  "tickFormatX": function (x) { return d3.time.format('%A')(x); }
};
var myChart = new xChart('line', data, '#example3', opts);Rendering:

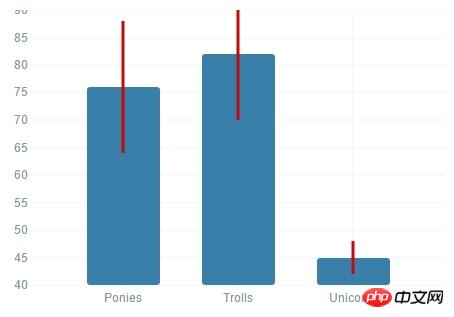
AnimationBalkendiagramm
JavaScript-Code:
var errorBar = {
  enter: function (self, storage, className, data, callbacks) {
    var insertionPoint = xChart.visutils.getInsertionPoint(9),
      container,
      // Map each error bar into 3 points, so it's easier to draw as a single path
      // Converts each point to a triplet with y from (y - e) to (y + e)
      // It would be better to use the `preUpdateScale` method here,
      // but for this quick example, we're taking a shortcut
      eData = data.map(function (d) {
        d.data = d.data.map(function (d) {
          return [{x: d.x, y: d.y - d.e}, {x: d.x, y: d.y}, {x: d.x, y: d.y + d.e}];
        });
        return d;
      }),
      paths;

    // It's always a good idea to create containers for sets
container = self._g.selectAll('.errorLine' + className)xChart.setVis('error', errorBar);
var data = {
    "xScale": "ordinal",
    "yScale": "linear",
    "main": [
      {
        "className": ".errorExample",
        "data": [
          {
            "x": "Ponies",
            "y": 12
          },
          {
            "x": "Unicorns",
            "y": 23
          },
          {
            "x": "Trolls",
            "y": 1
          }
        ]
      }
    ],
    "comp": [
      {
        "type": "error",
        "className": ".comp.errorBar",
        "data": [
          {
            "x": "Ponies",
            "y": 12,
            "e": 5
          },
          {
            "x": "Unicorns",
            "y": 23,
            "e": 2
          },
          {
            "x": "Trolls",
            "y": 1,
            "e": 1
          }
        ]
      }
    ]
};Rendering:

Zusammenfassung
xCharts ist sehr leistungsfähig. Wenn Sie Diagramme in Ihrer Webanwendung verwenden müssen, ist xCharts sehr gut für Sie geeignet .
Das obige ist der detaillierte Inhalt vonAusführliche Erklärung des xCharts-D3-basierten JavaScript-Diagrammbibliothekscodes (Bild). Für weitere Informationen folgen Sie bitte anderen verwandten Artikeln auf der PHP chinesischen Website!

Heiße KI -Werkzeuge

Undresser.AI Undress
KI-gestützte App zum Erstellen realistischer Aktfotos

AI Clothes Remover
Online-KI-Tool zum Entfernen von Kleidung aus Fotos.

Undress AI Tool
Ausziehbilder kostenlos

Clothoff.io
KI-Kleiderentferner

AI Hentai Generator
Erstellen Sie kostenlos Ai Hentai.

Heißer Artikel

Heiße Werkzeuge

Notepad++7.3.1
Einfach zu bedienender und kostenloser Code-Editor

SublimeText3 chinesische Version
Chinesische Version, sehr einfach zu bedienen

Senden Sie Studio 13.0.1
Leistungsstarke integrierte PHP-Entwicklungsumgebung

Dreamweaver CS6
Visuelle Webentwicklungstools

SublimeText3 Mac-Version
Codebearbeitungssoftware auf Gottesniveau (SublimeText3)

Heiße Themen
 So implementieren Sie ein Online-Spracherkennungssystem mit WebSocket und JavaScript
Dec 17, 2023 pm 02:54 PM
So implementieren Sie mit WebSocket und JavaScript ein Online-Spracherkennungssystem. Einführung: Mit der kontinuierlichen Weiterentwicklung der Technologie ist die Spracherkennungstechnologie zu einem wichtigen Bestandteil des Bereichs der künstlichen Intelligenz geworden. Das auf WebSocket und JavaScript basierende Online-Spracherkennungssystem zeichnet sich durch geringe Latenz, Echtzeit und plattformübergreifende Eigenschaften aus und hat sich zu einer weit verbreiteten Lösung entwickelt. In diesem Artikel wird erläutert, wie Sie mit WebSocket und JavaScript ein Online-Spracherkennungssystem implementieren.
 WebSocket und JavaScript: Schlüsseltechnologien zur Implementierung von Echtzeitüberwachungssystemen
Dec 17, 2023 pm 05:30 PM
WebSocket und JavaScript: Schlüsseltechnologien zur Realisierung von Echtzeit-Überwachungssystemen Einführung: Mit der rasanten Entwicklung der Internet-Technologie wurden Echtzeit-Überwachungssysteme in verschiedenen Bereichen weit verbreitet eingesetzt. Eine der Schlüsseltechnologien zur Erzielung einer Echtzeitüberwachung ist die Kombination von WebSocket und JavaScript. In diesem Artikel wird die Anwendung von WebSocket und JavaScript in Echtzeitüberwachungssystemen vorgestellt, Codebeispiele gegeben und deren Implementierungsprinzipien ausführlich erläutert. 1. WebSocket-Technologie
 So implementieren Sie ein Online-Reservierungssystem mit WebSocket und JavaScript
Dec 17, 2023 am 09:39 AM
So implementieren Sie ein Online-Reservierungssystem mit WebSocket und JavaScript. Im heutigen digitalen Zeitalter müssen immer mehr Unternehmen und Dienste Online-Reservierungsfunktionen bereitstellen. Es ist von entscheidender Bedeutung, ein effizientes Online-Reservierungssystem in Echtzeit zu implementieren. In diesem Artikel wird erläutert, wie Sie mit WebSocket und JavaScript ein Online-Reservierungssystem implementieren, und es werden spezifische Codebeispiele bereitgestellt. 1. Was ist WebSocket? WebSocket ist eine Vollduplex-Methode für eine einzelne TCP-Verbindung.
 Verwendung von JavaScript und WebSocket zur Implementierung eines Echtzeit-Online-Bestellsystems
Dec 17, 2023 pm 12:09 PM
Einführung in die Verwendung von JavaScript und WebSocket zur Implementierung eines Online-Bestellsystems in Echtzeit: Mit der Popularität des Internets und dem Fortschritt der Technologie haben immer mehr Restaurants damit begonnen, Online-Bestelldienste anzubieten. Um ein Echtzeit-Online-Bestellsystem zu implementieren, können wir JavaScript und WebSocket-Technologie verwenden. WebSocket ist ein Vollduplex-Kommunikationsprotokoll, das auf dem TCP-Protokoll basiert und eine bidirektionale Kommunikation zwischen Client und Server in Echtzeit realisieren kann. Im Echtzeit-Online-Bestellsystem, wenn der Benutzer Gerichte auswählt und eine Bestellung aufgibt
 JavaScript und WebSocket: Aufbau eines effizienten Echtzeit-Wettervorhersagesystems
Dec 17, 2023 pm 05:13 PM
JavaScript und WebSocket: Aufbau eines effizienten Echtzeit-Wettervorhersagesystems Einführung: Heutzutage ist die Genauigkeit von Wettervorhersagen für das tägliche Leben und die Entscheidungsfindung von großer Bedeutung. Mit der Weiterentwicklung der Technologie können wir genauere und zuverlässigere Wettervorhersagen liefern, indem wir Wetterdaten in Echtzeit erhalten. In diesem Artikel erfahren Sie, wie Sie mit JavaScript und WebSocket-Technologie ein effizientes Echtzeit-Wettervorhersagesystem aufbauen. In diesem Artikel wird der Implementierungsprozess anhand spezifischer Codebeispiele demonstriert. Wir
 Einfaches JavaScript-Tutorial: So erhalten Sie den HTTP-Statuscode
Jan 05, 2024 pm 06:08 PM
JavaScript-Tutorial: So erhalten Sie HTTP-Statuscode. Es sind spezifische Codebeispiele erforderlich. Vorwort: Bei der Webentwicklung ist häufig die Dateninteraktion mit dem Server erforderlich. Bei der Kommunikation mit dem Server müssen wir häufig den zurückgegebenen HTTP-Statuscode abrufen, um festzustellen, ob der Vorgang erfolgreich ist, und die entsprechende Verarbeitung basierend auf verschiedenen Statuscodes durchführen. In diesem Artikel erfahren Sie, wie Sie mit JavaScript HTTP-Statuscodes abrufen und einige praktische Codebeispiele bereitstellen. Verwenden von XMLHttpRequest
 So verwenden Sie insertBefore in Javascript
Nov 24, 2023 am 11:56 AM
Verwendung: In JavaScript wird die Methode insertBefore() verwendet, um einen neuen Knoten in den DOM-Baum einzufügen. Diese Methode erfordert zwei Parameter: den neuen Knoten, der eingefügt werden soll, und den Referenzknoten (d. h. den Knoten, an dem der neue Knoten eingefügt wird).
 So erhalten Sie auf einfache Weise HTTP-Statuscode in JavaScript
Jan 05, 2024 pm 01:37 PM
Einführung in die Methode zum Abrufen des HTTP-Statuscodes in JavaScript: Bei der Front-End-Entwicklung müssen wir uns häufig mit der Interaktion mit der Back-End-Schnittstelle befassen, und der HTTP-Statuscode ist ein sehr wichtiger Teil davon. Das Verstehen und Abrufen von HTTP-Statuscodes hilft uns, die von der Schnittstelle zurückgegebenen Daten besser zu verarbeiten. In diesem Artikel wird erläutert, wie Sie mithilfe von JavaScript HTTP-Statuscodes erhalten, und es werden spezifische Codebeispiele bereitgestellt. 1. Was ist ein HTTP-Statuscode? HTTP-Statuscode bedeutet, dass der Dienst den Dienst anfordert, wenn er eine Anfrage an den Server initiiert


