

[root@mxqmongodb2 tpccmysql]# gunzip tpcc-mysql-src.tgz[root@mxqmongodb2 tpccmysql]# tar xf tpcc-mysql-src.tar[root@mxqmongodb2 tpcc-mysql-master]# cd src/[root@mxqmongodb2 src]# make[root@mxqmongodb2 src]# cd ..[root@mxqmongodb2 tpcc-mysql-master]# ls
add_fkey_idx.sql count.sql create_table.sql Dockerfile drop_cons.sql load_multi_schema.sh load.sh README.md schema2 scripts src tpcc_load tpcc_start
mysql> create database tpcc1000;
Query OK, 1 row affected (0.04 sec)
mysql> use tpcc1000;Database changed
mysql> source /home/tpccmysql/tpcc-mysql-master/create_table.sql;
mysql> source /home/tpccmysql/tpcc-mysql-master/add_fkey_idx.sql;
[root@mxqmongodb2 tpcc-mysql-master]# ./tpcc_start --help****************************************** ###easy### TPC-C Load Generator ******************************************./tpcc_start: invalid option -- '-'Usage: tpcc_start -h server_host -P port -d database_name -u mysql_user -p mysql_password -w warehouses -c connections -r warmup_time -l running_time -i report_interval -f report_file -t trx_file
./tpcc_start -h10.103.16.35 -P3306 -dtpcc1000 -uroot -p123456 -w30 -c50 -r300 -l600
[root@mxqmongodb2 tpcc-mysql]# ./tpcc_start -h127.0.0.1 -P3306 -d tpcc -u root -p123456 -w 10 -c 50 -r 30 -l 300****************************************** ###easy### TPC-C Load Generator ******************************************option h with value '127.0.0.1'option P with value '3306'option d with value 'tpcc'option u with value 'root'option p with value '123456'option w with value '10'option c with value '50'option r with value '30'option l with value '300'<Parameters>[server]: 127.0.0.1[port]: 3306[DBname]: tpcc[user]: root[pass]: 123456[warehouse]: 10[connection]: 50[rampup]: 30 (sec.)[measure]: 300 (sec.)

RAMP-UP TIME.(30 sec.)

MEASURING START.
10, 140(0):3.055|3.476, 141(0):0.693|0.975, 14(0):0.326|0.334, 11(0):3.550|3.593, 15(0):9.091|9.11920, 240(0):3.092|3.143, 242(0):0.668|0.730, 24(0):0.320|0.356, 26(0):3.533|3.596, 23(0):8.280|8.48030, 232(0):2.981|3.110, 233(0):0.680|1.052, 23(0):0.329|0.360, 24(0):3.591|3.596, 23(0):9.042|9.40740, 137(0):3.148|3.968, 136(0):0.658|0.713, 14(0):0.329|0.353, 13(0):3.677|3.682, 15(0):8.660|9.28950, 149(0):2.984|3.334, 145(0):0.662|0.665, 14(0):0.310|0.334, 14(0):3.572|3.687, 13(0):9.155|9.49760, 137(0):2.863|3.152, 142(0):0.674|0.689, 15(0):0.247|0.262, 14(0):3.308|3.548, 15(0):8.362|9.23670, 157(0):3.144|3.410, 152(0):0.619|0.681, 15(0):0.339|0.414, 16(0):3.546|3.610, 16(0):8.440|9.62780, 184(0):3.073|3.221, 182(0):0.678|0.707, 18(0):0.352|0.352, 18(0):3.693|3.766, 19(0):8.643|9.02090, 192(0):3.035|3.668, 196(0):0.658|0.793, 20(0):0.298|0.400, 19(0):3.572|4.125, 18(0):8.267|9.535100, 156(0):3.041|3.301, 153(0):0.647|0.679, 15(0):0.276|0.279, 16(0):3.436|3.497, 17(0):8.379|8.510110, 167(0):2.900|3.178, 168(0):0.663|0.674, 17(0):0.294|0.297, 16(0):3.517|3.625, 16(0):8.262|8.626120, 188(0):3.094|3.217, 190(0):0.638|0.740, 19(0):0.276|0.288, 20(0):3.472|3.697, 19(0):8.589|8.891130, 161(0):3.295|3.617, 163(0):0.668|0.717, 16(0):0.346|0.393, 15(0):3.421|3.730, 16(0):9.250|10.387140, 171(0):2.938|3.343, 168(0):0.683|0.714, 17(0):0.312|0.321, 18(0):3.471|3.513, 18(0):8.190|8.602150, 179(0):3.029|3.250, 178(0):0.694|0.813, 18(0):0.329|0.331, 16(0):3.571|3.623, 16(0):8.097|8.610160, 123(0):2.938|3.333, 119(0):0.606|0.621, 12(0):0.278|0.293, 13(0):3.497|3.506, 13(0):8.327|8.454170, 175(0):3.130|3.595, 179(0):0.666|0.778, 17(0):0.274|0.277, 18(0):3.638|4.027, 18(0):8.762|9.156180, 187(0):3.146|3.427, 187(0):0.704|0.743, 20(0):0.312|0.322, 19(0):3.562|3.593, 18(0):8.282|9.524190, 146(0):2.926|3.112, 143(0):0.641|0.701, 14(0):0.301|0.339, 14(0):3.475|3.592, 15(0):7.896|8.596200, 189(0):3.028|3.277, 200(0):0.661|0.730, 19(0):0.300|0.319, 20(0):3.550|3.595, 20(0):8.361|8.659210, 191(0):2.910|3.196, 184(0):0.618|0.720, 19(0):0.324|0.329, 17(0):3.448|3.463, 18(0):8.372|8.558220, 143(0):3.057|3.116, 162(0):0.655|0.691, 15(0):0.259|0.355, 15(0):3.519|3.547, 14(0):8.816|8.893230, 189(0):2.930|3.057, 169(0):0.630|0.682, 18(0):0.331|0.349, 19(0):3.575|3.864, 19(0):8.359|8.391240, 131(0):2.958|3.035, 130(0):0.643|0.681, 14(0):0.273|0.326, 12(0):3.490|3.520, 13(0):8.671|9.160250, 125(0):2.939|3.237, 124(0):0.659|0.707, 12(0):0.301|0.367, 12(0):3.464|3.527, 13(0):8.643|8.774260, 127(0):2.895|2.983, 131(0):0.669|0.704, 13(0):0.328|0.360, 16(0):3.468|3.665, 12(0):8.433|8.562270, 177(0):2.962|3.375, 174(0):0.686|0.722, 17(0):0.302|0.364, 16(0):3.548|3.629, 18(0):8.309|8.354280, 139(0):2.874|3.047, 142(0):0.675|0.935, 15(0):0.280|0.294, 16(0):3.483|3.628, 14(0):8.154|8.730290, 163(0):3.132|3.213, 162(0):0.636|0.663, 15(0):0.282|0.313, 15(0):3.654|3.925, 17(0):8.172|8.245300, 147(0):3.024|3.230, 142(0):0.692|1.405, 16(0):0.265|0.300, 15(0):3.452|3.475, 14(0):8.518|9.214
 STOPPING THREADS..................................................
<Raw Results> -- 第一次统计结果[0] sc:4942 lt:0 rt:0 fl:0 -- New-Order,新订单业务成功(success,简写sc)次数,延迟(late,简写lt)次数,重试(retry,简写rt)次数,失败(failure,简写fl)次数[1] sc:4937 lt:0 rt:0 fl:0 -- Payment,支付业务统计[2] sc:495 lt:0 rt:0 fl:0 -- Order-Status,订单状态业务统计[3] sc:493 lt:0 rt:0 fl:0 -- Delivery,发货业务统计[4] sc:495 lt:0 rt:0 fl:0 -- Stock-Level,库存业务统计in 300 sec.
<Raw Results2(sum ver.)> -- 第二次统计结果[0] sc:4944 lt:0 rt:0 fl:0[1] sc:4940 lt:0 rt:0 fl:0[2] sc:495 lt:0 rt:0 fl:0[3] sc:493 lt:0 rt:0 fl:0[4] sc:495 lt:0 rt:0 fl:0
 <Constraint Check> (all must be [OK]) -- 下面所有业务逻辑结果都必须为 OK 才行[transaction percentage]Payment: 43.45% (>=43.0%) [OK]Order-Status: 4.36% (>= 4.0%) [OK]Delivery: 4.34% (>= 4.0%) [OK]Stock-Level: 4.36% (>= 4.0%) [OK][response time (at least 90% passed)]New-Order: 100.00% [OK]Payment: 100.00% [OK]Order-Status: 100.00% [OK]Delivery: 100.00% [OK]Stock-Level: 100.00% [OK]
 <TpmC>988.400 TpmC-- TpmC结果值(每分钟事务数,该值是第一次统计结果中的新订单事务数除以总耗时分钟数)
mysql> show variables like 'innodb_buffer_pool_size';+-------------------------+------------+| Variable_name | Value |+-------------------------+------------+| innodb_buffer_pool_size | 2147483648 |+-------------------------+------------+1 row in set (0.17 sec)
[root@mxqmongodb2 tpcc-mysql]# ./tpcc_start -h127.0.0.1 -P3306 -d tpcc -u root -p123456 -w 10 -c 50 -r 10 -l 120 >/home/sa/tpcc_output_2048.log
mysql> set global innodb_buffer_pool_size=134217728;
Query OK, 0 rows affected (0.05 sec)
mysql> show variables like 'innodb_buffer_pool_size';+-------------------------+------------+| Variable_name | Value |+-------------------------+------------+| innodb_buffer_pool_size | 134217728|+-------------------------+------------+1 row in set (0.01 sec)[root@mxqmongodb2 tpcc-mysql]# ./tpcc_start -h127.0.0.1 -P3306 -d tpcc -u root -p123456 -w 10 -c 50 -r 10 -l 1200 >/home/sa/tpcc_output_128.log
[root@mxqmongodb2 sa]# cat tpcc_output_128.log | grep '(0)' | grep -v HY000 | grep -v payment | grep -v neword | awk -F ':' '{print $1}' |awk -F ',' '{print $1 $2}'|sed 's/(0)//g'|sed 's/(1)//g'>tpcc_output_1128.txt[root@mxqmongodb2 sa]# cat tpcc_output_2048.log | grep '(0)' | grep -v HY000 | grep -v payment | grep -v neword | awk -F ':' '{print $1}' |awk -F ',' '{print $1 $2}'|sed 's/(0)//g'|sed 's/(1)//g'>tpcc_output_2048.txt
[root@mxqmongodb2 sa]# paste tpcc_output_128.txt tpcc_output_2048.txt > tpcc-graph-data128.txt[root@mxqmongodb2 sa]# ./tpcc-graph-build.sh tpcc-graph-data128.txt tpcc-graph128-2048.jpg
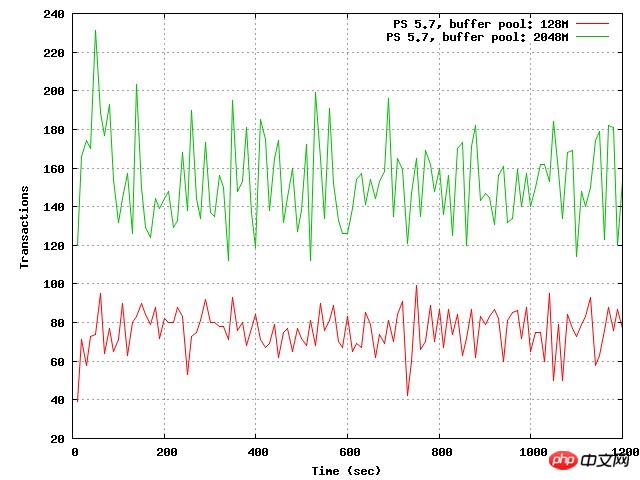
#!/bin/bash
### goto user homedir and remove previous filerm -f '$2'gnuplot << EOP
### set data source filedatafile = '$1'### set graph type and size
set terminal jpeg size 640,480### set titles
set grid x y
set xlabel "Time (sec)"set ylabel "Transactions"### set output filename
set output '$2'### build graph
# plot datafile with lines
plot datafile title "PS 5.7, buffer pool: 128M" with lines,datafile using 3:4 title "PS 5.7, buffer pool: 2048M" with lines axes x1y1
EOP
Das obige ist der detaillierte Inhalt vonBeispiel-Tutorial zur Installation, zum Testen und zur Verwendung von tpcc-mysql. Für weitere Informationen folgen Sie bitte anderen verwandten Artikeln auf der PHP chinesischen Website!


![[Web-Frontend] Node.js-Schnellstart](https://img.php.cn/upload/course/000/000/067/662b5d34ba7c0227.png)


