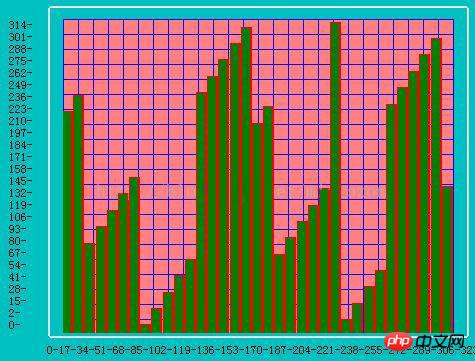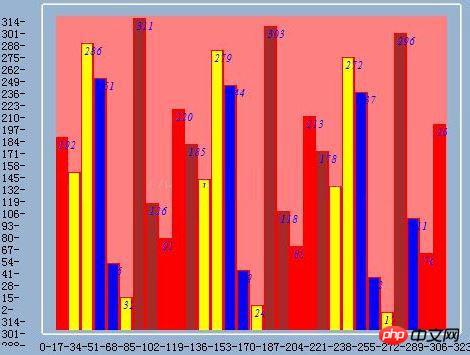
Dieser Artikel stellt hauptsächlich die Methode zur Realisierung dynamischer Datenzeichnungsgrafiken in C# vor und analysiert die zugehörigen Betriebstechniken von C# zum Zeichnen von 2D-Datentabellen basierend auf dynamischen Daten in Form von Beispielen Dieser Artikel
Beschreibt die Methode zur Implementierung dynamischer Datenzeichnungsgrafiken in C#. Teilen Sie es als Referenz mit allen. Die Details lauten wie folgt:
using System;
using System.Collections.Generic;
using System.ComponentModel;
using System.Data;
using System.Drawing;
using System.Linq;
using System.Text;
using System.Windows.Forms;
using System.Drawing.Drawing2D;
namespace Drawing
{
  public partial class Form1 : Form
  {
    public Form1()
    {
      InitializeComponent();
    }
    private int WidthAdded = 0;
    private int HeightAdded = 0;
    private int Added_Value = 15;
    private int Incremented = 3;
    private double Width_Max = 0.0f;
    private double Height_Max = 0f;
    private string hstrlink;
    private string vstrlink;
    private const int hor_kedu=17;
    private const int ver_kedu = 13;
    private double HelpRdm = 0;
    private void Form1_Load(object sender, EventArgs e)
    {
      Width_Max=Convert.ToDouble(panel.ClientSize.Width);
      Height_Max = Convert.ToDouble(panel.ClientSize.Height);
      BtnStatusInfoForb();
    }
    private void button1_Click(object sender, EventArgs e)
    {
      Graphics myGraphics_framwork;
      Pen myPen = new Pen(Color.Blue, 0.25f);
      myGraphics_framwork = panel.CreateGraphics();
      for (int Increment = 0; Increment < panel.Height; Increment += Incremented)
      {
        myGraphics_framwork.DrawLine(myPen, 0, HeightAdded, panel.ClientSize.Width, HeightAdded);
        HeightAdded = HeightAdded + Added_Value;
      }
      for (int Increment = 0; Increment < panel.Height; Increment += Incremented)
      {
        myGraphics_framwork.DrawLine(myPen, WidthAdded, 0, WidthAdded, panel.ClientSize.Height);
        WidthAdded = WidthAdded + Added_Value;
      }
      myGraphics_framwork.Dispose();
      for (int hstart = 0; hstart < Width_Max; hstart += hor_kedu)
      {
        hstrlink = hstrlink + hstart.ToString() + "-";
      }
      label2.Text = hstrlink;
      for (int start = (int)Height_Max; start > 0; start -= ver_kedu)
      {
        vstrlink = vstrlink + start.ToString() + "-" + "\n";
      }
      label3.Text = vstrlink + "0-";
      BtnStatusInfoActi();
      button1.Enabled = false;
    }
    private void BtnStatusInfoForb()
    {
      button2.Enabled = false;
      button3.Enabled = false;
      button4.Enabled = false;
      trackBar1.Enabled = false;
      Rec_NumBox.Enabled = false;
    }
    private void BtnStatusInfoActi()
    {
      button2.Enabled = true;
      button3.Enabled = true;
      button4.Enabled = true;
      trackBar1.Enabled = true;
      Rec_NumBox.Enabled = true;
    }
    private void myfun()
    {
      Graphics myGraphics = panel.CreateGraphics();
      Font myFont = new Font("Times New Roman", 72, FontStyle.Italic);
      Point startPoint = new Point(0, 0);
      Point endPoint = new Point(30, 30);
      LinearGradientBrush myBrush = new LinearGradientBrush(startPoint, endPoint, Color.Black, Color.Yellow);
      myBrush.WrapMode = WrapMode.TileFlipXY;
      myGraphics.DrawString("String", myFont, myBrush, 0, 0);
    }
    private void button2_Click(object sender, EventArgs e)
    {
      if (ParaBox1.Text == null)
      {
        MessageBox.Show("请输入矩形的高度");
      }
      else
      {
        try
        {
          Graphics myGraphics_Rectangle = panel.CreateGraphics();
          Pen myPen_Rec = new Pen(Color.Red, 3);
          Rectangle rect = new Rectangle();
          rect.X = 20; rect.Y = panel.ClientSize.Height - Convert.ToInt32(ParaBox1.Text);
          rect.Width = 20; rect.Height = panel.ClientSize.Height;
          myGraphics_Rectangle = panel.CreateGraphics();
          myGraphics_Rectangle.DrawRectangle(myPen_Rec, rect);
          SolidBrush MyRectBrush = new SolidBrush(Color.Purple);
          myGraphics_Rectangle.FillRectangle(MyRectBrush, rect);
          myGraphics_Rectangle.Dispose();
        }
        catch (Exception Excp)
        {
          MessageBox.Show(Excp.Message);
        }
      }
    }
    /// <summary>
    ///
    /// </summary>
    /// <param name="sender"></param>
    /// <param name="e"></param>
    private void button3_Click(object sender, EventArgs e)
    {
      Graphics myGraphics_Rectangle = panel.CreateGraphics();
      if (Rec_NumBox == null)
      {
        MessageBox.Show("请输入你要绘制的矩形数量");
      }
      else
      {
        double count = Convert.ToInt32(Rec_NumBox.Text);
        double TableSpace = (1 * Width_Max) / (4 * count);
        double TableWidth = (3 * Width_Max) / (4 * count);
        double RecOffset = TableWidth + TableSpace;//
        Pen myPen_Rec = new Pen(Color.Red, 3);
        for (long RectNum = 0; RectNum < count; RectNum++)
        {
          Random Radom = new Random();
          System.Threading.Thread.Sleep(20);
          double RandomHegiht =Radom.Next(0, Convert.ToInt32(Height_Max));
          Rectangle rect = new Rectangle();
          rect.X =Convert.ToInt32(RectNum*RecOffset);
          rect.Y = Convert.ToInt32(panel.ClientSize.Height - RandomHegiht);
          rect.Width = Convert.ToInt32(TableWidth);
          rect.Height = panel.ClientSize.Height;
          myGraphics_Rectangle = panel.CreateGraphics();
          myGraphics_Rectangle.DrawRectangle(myPen_Rec, rect);
          SolidBrush MyRectBrush = new SolidBrush(Color.Green);
          myGraphics_Rectangle.FillRectangle(MyRectBrush, rect);
        }
      myGraphics_Rectangle.Dispose();
      }
      Rec_NumBox.Text = Added_Value.ToString();
      Added_Value = Added_Value+50;
    }
    private void button4_Click(object sender, EventArgs e)
    {
      StringFormat sf=new StringFormat();
      sf.Alignment = StringAlignment.Near;
      Graphics myGraphics = panel.CreateGraphics();
      RectangleF REf = new RectangleF(12, 30, 8, 38);
      Font myFont = new Font("Times New Roman", 62, FontStyle.Italic);
      Point startPoint = new Point(0, 0);
      Point endPoint = new Point(30, 30);
      LinearGradientBrush myBrush = new LinearGradientBrush(startPoint, endPoint, Color.Green, Color.Blue);
      SolidBrush MyRectBrush = new SolidBrush(Color.Purple);
      myBrush.WrapMode = WrapMode.TileFlipXY;
      myGraphics.DrawString("b2spirit", myFont, myBrush, 0, 0);
      Random r=new Random();
      int temp=r.Next(10,300);
      myGraphics.DrawString(temp.ToString(), myFont, MyRectBrush, REf, sf);
    }
    private void trackBar1_Scroll(object sender, EventArgs e)
    {
      TrackBar myTB=new TrackBar();
      myTB=(TrackBar)sender;
      Rec_NumBox.Text = myTB.Value.ToString();
    }
  }
}Screenshot


Das obige ist der detaillierte Inhalt vonEinführung in die Implementierungsmethode der dynamischen C#-Datenzeichnungsgrafik. Für weitere Informationen folgen Sie bitte anderen verwandten Artikeln auf der PHP chinesischen Website!
 So führen Sie ein Shell-Skript aus
 So kaufen und verkaufen Sie Bitcoin auf Binance
 Was bedeutet Bildrate?
 Verwendung der Längenfunktion
 So bezahlen Sie mit WeChat auf Douyin
 Der Zweck des Befehls rm-rf unter Linux
 Welche Fehlerkorrektursysteme für Domainnamen gibt es?
 echarts adaptive Größeneinstellungen
 Was ist Python-Programmierung?


