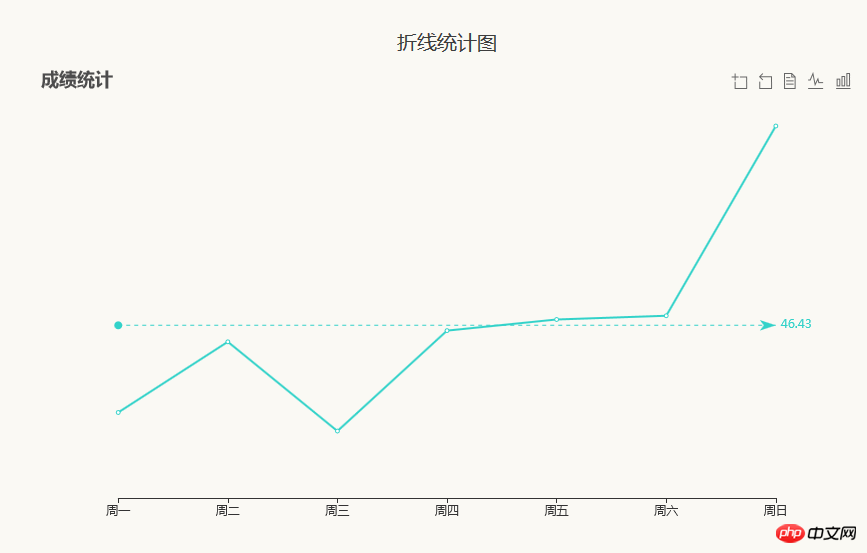
Der Inhalt dieses Artikels befasst sich mit der Implementierung des Liniendiagramms von echarts.js. Der Implementierungscode des Linienstatistikdiagramms von echarts.j hat einen gewissen Referenzwert. Freunde in Not können sich darauf beziehen.
<!DOCTYPE html PUBLIC "-//W3C//DTD XHTML 1.0 Transitional//EN" "http://www.w3.org/TR/xhtml1/DTD/xhtml1-transitional.dtd">
<html xmlns="http://www.w3.org/1999/xhtml">
<head>
<meta http-equiv="Content-Type" content="text/html; charset=utf-8" />
<title>常用的数据统计图</title>
<link type="text/css" rel="stylesheet" href="./css/index.css" />
<style type="text/css">
body{font-size:14px;color:#000;user-select:none;-webkit-user-select:none;-webkit-text-size-adjust:none;background-color:#fff;}
html,body{height:100%;}
*{font-family:"微软雅黑","华文细黑",Arial,Helvetica,sans-serif;}
a,input,div,textarea{outline:none;}
html,body,h1,h2,h3,h4,h5,h6,p,dl,dd,ol,ul,th,td,form,fieldset,input,button,textarea,a{margin:0;padding:0}
input,textarea,select{text-decoration:none;outline:0 none;resize:none;-webkit-tap-highlight-color:rgba(0,0,0,0);-webkit-appearance:none;border-radius:0;}
ul,dl,ol{list-style:none;}
ul,li{list-style:none;}
fieldset,img{border:0;}
a{text-decoration:none;outline:0 none;}
body{background-color:#faf9f4;}
p{color:#3d3d3d;font-size:20px;text-align:center;padding:100px 0 10px 0;}
#ring,#line,#pillar1,#pillar2{margin:0 auto;}
.null{padding-bottom:100px;}
</style>
</head>
<body>
<p>折线统计图</p>
<div id="line" style="width:822px;height:492px;"></div>
<div class="null"></div>
<script src="https://cdn.bootcss.com/jquery/3.3.1/jquery.min.js"></script>
<script src="https://cdn.bootcss.com/echarts/4.1.0.rc2/echarts.min.js"></script>
<!-- <script type="text/javascript" src="./js/jquery-1.7.2-min.js"></script>
<script type="text/javascript" src="./js/echarts.min.js"></script> -->
<script type="text/javascript">
// JavaScript Document
// echarts
// create for AgnesXu at 20161115
//折线图
var line = echarts.init(document.getElementById('line'));
line.setOption({
color:["#32d2c9"],
title: {
x: 'left',
text: '成绩统计',
textStyle: {
fontSize: '18',
color: '#4c4c4c',
fontWeight: 'bolder'
}
},
tooltip: {
trigger: 'axis'
},
toolbox: {
show: true,
orient: 'horizontal',
feature: {
dataZoom: {
yAxisIndex: 'none'
},
dataView: {readOnly: false},
magicType: {type: ['line', 'bar']}
}
},
xAxis: {
type: 'category',
boundaryGap: false,
data: ['周一','周二','周三','周四','周五','周六','周日'],
axisLabel: {
interval:0
}
},
yAxis: {
show: false,
type: 'value',
axisLabel: {
formatter: '{value} °C'
}
},
series: [
{
name:'成绩',
type:'line',
data:[23, 42, 18, 45, 48, 49,100],
markLine: {data: [{type: 'average', name: '平均值'}]}
}
]
}) ;
</script>
</body>
</html>Die laufenden Ergebnisse sind wie folgt:

Verwandte Empfehlungen:
JQplots Liniendiagramm icon_html/css_WEB-ITnose
echarts legt die Polylinie fest Linienfarbe und Polylinienpunktfarbe Beispiel für
Das obige ist der detaillierte Inhalt vonWie implementiert man das Liniendiagramm in echarts.js? Implementierungscode des statistischen Liniendiagramms von echarts.js. Für weitere Informationen folgen Sie bitte anderen verwandten Artikeln auf der PHP chinesischen Website!


