Implementierungscode häufig verwendeter Echarts-Diagramme
Der Inhalt dieses Artikels befasst sich mit dem Implementierungscode häufig verwendeter Echarts-Diagramme. Er hat einen gewissen Referenzwert. Ich hoffe, dass er für Sie hilfreich ist.
Der Code dieses Artikels wurde auf Basis von ehcarts4.0 entwickelt
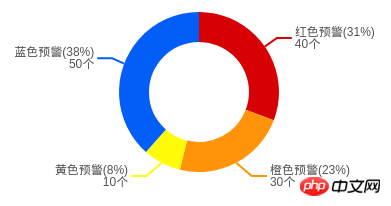
Kreisdiagramm

// 饼图配置项
    var option = {
        series: [
            {
                name:'风险预警占比',
                type: 'pie',
                radius: ['25%', '40%'],
                center: ['50%', '50%'],
                roseType: false,
                data: [
                    {
                        value: 40,
                        name: '红色预警'
                    }, {
                        value: 30,
                        name: '橙色预警'
                    }, {
                        value: 10,
                        name: '黄色预警'
                    }, {
                        value: 50,
                        name: '蓝色预警'
                    }
                ],
                label: {
                    fontSize: 12,
                    color:'#545454',
                    formatter: function (param) {
                        return param.name + '(' + Math.round(param.percent) + '%' + ')'
                            + '\n' + param.value +  '个';
                    }
                },
                labelLine: {
                    smooth: false,
                    lineStyle: {
                        width: 2
                    }
                },
                itemStyle: {
                    color:function(params){
                        switch (params.name) {
                            case '红色预警':
                                return '#D70002';
                            case '橙色预警':
                                return '#FF9309';
                            case '黄色预警':
                                return '#FFFB09';
                            case '蓝色预警':
                                return '#035EF7';
                            default:
                                break;
                        }
                    }
                },
            }
        ]
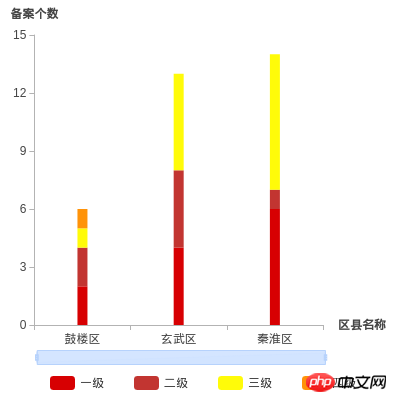
}Gestapeltes Säulendiagramm

//堆叠柱状图配置项
  var option = {
      backgroundColor: '#fff',
      tooltip: {
          trigger: 'axis',
          axisPointer: {
              type: 'shadow'
          }
      },
      legend: {
          bottom: '10',
          itemGap: 30,
          data: ['一级', '二级', '三级', '四级']
      },
      grid: { //图表的位置
          top: 30,
          left: 10,
          right: 80,
          bottom: 60,
          containLabel: true
      },
      dataZoom: [
          {
              type: 'inside'
          }, {
              type: 'slider',
              start: 0,
              bottom: 40,
              height: '15px',
              fillerColor:'rgba(202,223,255,.8)',
              borderColor:'#b6d2fc',
              handleStyle:{
                  color:'#b6d2fc'
              },
              dataBackground:{
                  lineStyle:{
                      color:'#b6d2fc'
                  },
                  areaStyle:{
                      color:'rgba(202,223,255,.8)'
                  }
              }
          }
      ],
      yAxis: [
          {
              type: 'value',
              name: '备案个数',
              nameTextStyle: {
                  fontSize: 12,
                  fontWeight: 'bold',
                  color: '#454545'
              },
              splitLine: {
                  show: false
              },
              axisLine: {
                  lineStyle: {
                      color: '#B3B3B3'
                  }
              },
              axisLabel: {
                  color: '#454545'
              }
          }
      ],
      xAxis: [
          {
              type: 'category',
              name: '区县名称',
              nameTextStyle: {
                  fontSize: 12,
                  fontWeight: 'bold',
                  color: '#454545'
              },
              axisLine: {
                  lineStyle: {
                      color: '#B3B3B3'
                  }
              },
              axisLabel: {
                  color: '#454545'
              },
              data: ['鼓楼区','玄武区','秦淮区']
          }
      ],
      series: [
          {
              name: '一级',
              type: 'bar',
              stack: '总量',
              barWidth: '10px',
              itemStyle:{
                  color:'#D70002'
              },
              data: [2,4,6]
          },
          {
              name: '二级',
              type: 'bar',
              stack: '总量',
              barWidth: '10px',
              data: [2,4,1]
          },
          {
              name: '三级',
              type: 'bar',
              stack: '总量',
              barWidth: '10px',
              itemStyle:{
                  color:'#FFFB09'
              },
              data: [1,5,7]
          },
          {
              name: '四级',
              type: 'bar',
              stack: '总量',
              barWidth: '10px',
              itemStyle:{
                  color:'#FF9309'
              },
              data: [1]
          }
      ]
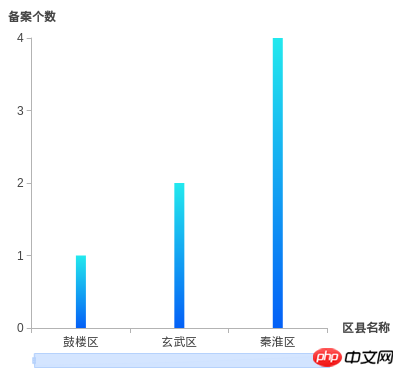
}Verlaufsbalkendiagramm

//配置项
var option = {
      backgroundColor: '#fff',
      color: [
          new echarts.graphic.LinearGradient(
              0, 0, 0, 1,
              [
                  { offset: 0, color: '#23E9EE' },
                  { offset: 1, color: '#0460F7' }
              ]
          )
      ],
      tooltip: {
          trigger: 'axis',
          axisPointer: {
              type: 'shadow'
          }
      },
      legend: {
          bottom: '10',
          itemGap: 30,
          data: ['一级', '二级', '三级', '四级']
      },
      grid: { //图表的位置
          top: 30,
          left: 10,
          right: 80,
          bottom: 60,
          containLabel: true
      },
      dataZoom: [
          {
              type: 'inside'
          }, {
              type: 'slider',
              start: 0,
              bottom: 40,
              height: '15px',
              fillerColor:'rgba(202,223,255,.8)',
              borderColor:'#b6d2fc',
              handleStyle:{
                  color:'#b6d2fc'
              },
              dataBackground:{
                  lineStyle:{
                      color:'#b6d2fc'
                  },
                  areaStyle:{
                      color:'rgba(202,223,255,.8)'
                  }
              }
          }
      ],
      yAxis: [
          {
              type: 'value',
              name: '备案个数',
              nameTextStyle: {
                  fontSize: 12,
                  fontWeight: 'bold',
                  color: '#454545'
              },
              splitLine: {
                  show: false
              },
              axisLine: {
                  lineStyle: {
                      color: '#B3B3B3'
                  }
              },
              axisLabel: {
                  color: '#454545'
              }
          }
      ],
      xAxis: [
          {
              type: 'category',
              name: '区县名称',
              nameTextStyle: {
                  fontSize: 12,
                  fontWeight: 'bold',
                  color: '#454545'
              },
              axisLine: {
                  lineStyle: {
                      color: '#B3B3B3'
                  }
              },
              axisLabel: {
                  color: '#454545'
              },
              data: ['鼓楼区','玄武区','秦淮区']
          }
      ],
      series: [
          {
              name: '报警',
              type: 'bar',
              stack: '总量',
              barWidth: '10px',
              data: [1,2,4]
          }
      ]
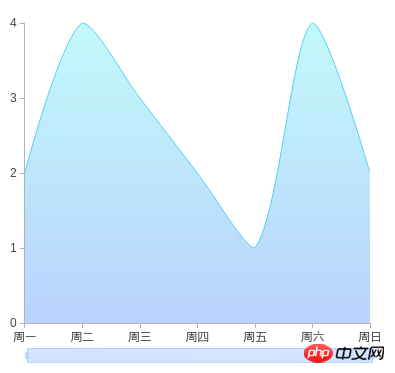
};Liniendiagramm

//线图配置项
var option = {
      tooltip: {
          trigger: 'axis'
      },
      color: [
          new echarts.graphic.LinearGradient(
              0, 0, 0, 1,
              [
                  {offset: 0, color: '#23E9EE'},
                  {offset: 1, color: '#0460F7'}
              ]
          )
      ],
      grid: {
          top: 30,
          left: 10,
          right: 30,
          bottom: 50,
          containLabel: true
      },
      dataZoom: [
          {
              type: 'inside'
          }, {
              type: 'slider',
              start: 0,
              bottom: 30,
              height: '15px',
              fillerColor:'rgba(202,223,255,.8)',
              borderColor:'#b6d2fc',
              handleStyle:{
                  color:'#b6d2fc'
              },
              dataBackground:{
                  lineStyle:{
                      color:'#b6d2fc'
                  },
                  areaStyle:{
                      color:'rgba(202,223,255,.8)'
                  }
              }
          }
      ],
      yAxis: [
          {
              type: 'value',
              splitLine: {
                  show: false
              },
              axisLine: {
                  lineStyle: {
                      color: '#B3B3B3'
                  }
              },
              axisLabel: {
                  color: '#454545'
              }
          }
      ],
      xAxis: {
          type: 'category',
          boundaryGap:false,
          axisLine: {
              lineStyle: {
                  color: '#B3B3B3'
              }
          },
          axisLabel: {
              color: '#454545'
          },
          data: ['周一', '周二', '周三', '周四', '周五', '周六', '周日']
      },
      series: [
          {
              name: '报警个数',
              type: 'line',
              symbol: 'emptyCircle',
              symbolSize: 2,
              showSymbol: false,
              smooth: true,
              areaStyle: {
                  color: new echarts.graphic.LinearGradient(
                      0, 0, 0, 1,
                      [
                          {offset: 0, color: 'rgba(35,233,238,.4)'},
                          {offset: 1, color: 'rgba(4,96,247,.4)'}
                      ]
                  )
              },
              lineStyle: {
                  width: 1,
                  color: '#59cef5'
              },
              itemStyle: {
                  borderColor: '#59cef5',
                  borderWidth: 2
              },
              data:[2,4,3,2,1,4,2]
          }
      ]
}Eine Instanz erstellen
var chart = echarts.init(document.getElementById('chartBox'));Konfigurationselemente der Diagramminstanz festlegen
Konfigurationselemente festlegen und Daten der Diagramminstanz, universelle Schnittstelle. Alle Parameter- und Datenänderungen können über setOption abgeschlossen werden, die neuen Parameter und Daten zusammenführen und dann das Diagramm aktualisierenDas obige ist der detaillierte Inhalt vonImplementierungscode häufig verwendeter Echarts-Diagramme. Für weitere Informationen folgen Sie bitte anderen verwandten Artikeln auf der PHP chinesischen Website!

Heiße KI -Werkzeuge

Undresser.AI Undress
KI-gestützte App zum Erstellen realistischer Aktfotos

AI Clothes Remover
Online-KI-Tool zum Entfernen von Kleidung aus Fotos.

Undress AI Tool
Ausziehbilder kostenlos

Clothoff.io
KI-Kleiderentferner

AI Hentai Generator
Erstellen Sie kostenlos Ai Hentai.

Heißer Artikel

Heiße Werkzeuge

Notepad++7.3.1
Einfach zu bedienender und kostenloser Code-Editor

SublimeText3 chinesische Version
Chinesische Version, sehr einfach zu bedienen

Senden Sie Studio 13.0.1
Leistungsstarke integrierte PHP-Entwicklungsumgebung

Dreamweaver CS6
Visuelle Webentwicklungstools

SublimeText3 Mac-Version
Codebearbeitungssoftware auf Gottesniveau (SublimeText3)

Heiße Themen
 1377
1377
 52
52
 So implementieren Sie ein Online-Spracherkennungssystem mit WebSocket und JavaScript
Dec 17, 2023 pm 02:54 PM
So implementieren Sie mit WebSocket und JavaScript ein Online-Spracherkennungssystem. Einführung: Mit der kontinuierlichen Weiterentwicklung der Technologie ist die Spracherkennungstechnologie zu einem wichtigen Bestandteil des Bereichs der künstlichen Intelligenz geworden. Das auf WebSocket und JavaScript basierende Online-Spracherkennungssystem zeichnet sich durch geringe Latenz, Echtzeit und plattformübergreifende Eigenschaften aus und hat sich zu einer weit verbreiteten Lösung entwickelt. In diesem Artikel wird erläutert, wie Sie mit WebSocket und JavaScript ein Online-Spracherkennungssystem implementieren.
 WebSocket und JavaScript: Schlüsseltechnologien zur Implementierung von Echtzeitüberwachungssystemen
Dec 17, 2023 pm 05:30 PM
WebSocket und JavaScript: Schlüsseltechnologien zur Realisierung von Echtzeit-Überwachungssystemen Einführung: Mit der rasanten Entwicklung der Internet-Technologie wurden Echtzeit-Überwachungssysteme in verschiedenen Bereichen weit verbreitet eingesetzt. Eine der Schlüsseltechnologien zur Erzielung einer Echtzeitüberwachung ist die Kombination von WebSocket und JavaScript. In diesem Artikel wird die Anwendung von WebSocket und JavaScript in Echtzeitüberwachungssystemen vorgestellt, Codebeispiele gegeben und deren Implementierungsprinzipien ausführlich erläutert. 1. WebSocket-Technologie
 Verwendung von JavaScript und WebSocket zur Implementierung eines Echtzeit-Online-Bestellsystems
Dec 17, 2023 pm 12:09 PM
Einführung in die Verwendung von JavaScript und WebSocket zur Implementierung eines Online-Bestellsystems in Echtzeit: Mit der Popularität des Internets und dem Fortschritt der Technologie haben immer mehr Restaurants damit begonnen, Online-Bestelldienste anzubieten. Um ein Echtzeit-Online-Bestellsystem zu implementieren, können wir JavaScript und WebSocket-Technologie verwenden. WebSocket ist ein Vollduplex-Kommunikationsprotokoll, das auf dem TCP-Protokoll basiert und eine bidirektionale Kommunikation zwischen Client und Server in Echtzeit realisieren kann. Im Echtzeit-Online-Bestellsystem, wenn der Benutzer Gerichte auswählt und eine Bestellung aufgibt
 So implementieren Sie ein Online-Reservierungssystem mit WebSocket und JavaScript
Dec 17, 2023 am 09:39 AM
So implementieren Sie ein Online-Reservierungssystem mit WebSocket und JavaScript. Im heutigen digitalen Zeitalter müssen immer mehr Unternehmen und Dienste Online-Reservierungsfunktionen bereitstellen. Es ist von entscheidender Bedeutung, ein effizientes Online-Reservierungssystem in Echtzeit zu implementieren. In diesem Artikel wird erläutert, wie Sie mit WebSocket und JavaScript ein Online-Reservierungssystem implementieren, und es werden spezifische Codebeispiele bereitgestellt. 1. Was ist WebSocket? WebSocket ist eine Vollduplex-Methode für eine einzelne TCP-Verbindung.
 JavaScript und WebSocket: Aufbau eines effizienten Echtzeit-Wettervorhersagesystems
Dec 17, 2023 pm 05:13 PM
JavaScript und WebSocket: Aufbau eines effizienten Echtzeit-Wettervorhersagesystems Einführung: Heutzutage ist die Genauigkeit von Wettervorhersagen für das tägliche Leben und die Entscheidungsfindung von großer Bedeutung. Mit der Weiterentwicklung der Technologie können wir genauere und zuverlässigere Wettervorhersagen liefern, indem wir Wetterdaten in Echtzeit erhalten. In diesem Artikel erfahren Sie, wie Sie mit JavaScript und WebSocket-Technologie ein effizientes Echtzeit-Wettervorhersagesystem aufbauen. In diesem Artikel wird der Implementierungsprozess anhand spezifischer Codebeispiele demonstriert. Wir
 Einfaches JavaScript-Tutorial: So erhalten Sie den HTTP-Statuscode
Jan 05, 2024 pm 06:08 PM
JavaScript-Tutorial: So erhalten Sie HTTP-Statuscode. Es sind spezifische Codebeispiele erforderlich. Vorwort: Bei der Webentwicklung ist häufig die Dateninteraktion mit dem Server erforderlich. Bei der Kommunikation mit dem Server müssen wir häufig den zurückgegebenen HTTP-Statuscode abrufen, um festzustellen, ob der Vorgang erfolgreich ist, und die entsprechende Verarbeitung basierend auf verschiedenen Statuscodes durchführen. In diesem Artikel erfahren Sie, wie Sie mit JavaScript HTTP-Statuscodes abrufen und einige praktische Codebeispiele bereitstellen. Verwenden von XMLHttpRequest
 So verwenden Sie insertBefore in Javascript
Nov 24, 2023 am 11:56 AM
Verwendung: In JavaScript wird die Methode insertBefore() verwendet, um einen neuen Knoten in den DOM-Baum einzufügen. Diese Methode erfordert zwei Parameter: den neuen Knoten, der eingefügt werden soll, und den Referenzknoten (d. h. den Knoten, an dem der neue Knoten eingefügt wird).
 So erhalten Sie auf einfache Weise HTTP-Statuscode in JavaScript
Jan 05, 2024 pm 01:37 PM
Einführung in die Methode zum Abrufen des HTTP-Statuscodes in JavaScript: Bei der Front-End-Entwicklung müssen wir uns häufig mit der Interaktion mit der Back-End-Schnittstelle befassen, und der HTTP-Statuscode ist ein sehr wichtiger Teil davon. Das Verstehen und Abrufen von HTTP-Statuscodes hilft uns, die von der Schnittstelle zurückgegebenen Daten besser zu verarbeiten. In diesem Artikel wird erläutert, wie Sie mithilfe von JavaScript HTTP-Statuscodes erhalten, und es werden spezifische Codebeispiele bereitgestellt. 1. Was ist ein HTTP-Statuscode? HTTP-Statuscode bedeutet, dass der Dienst den Dienst anfordert, wenn er eine Anfrage an den Server initiiert


