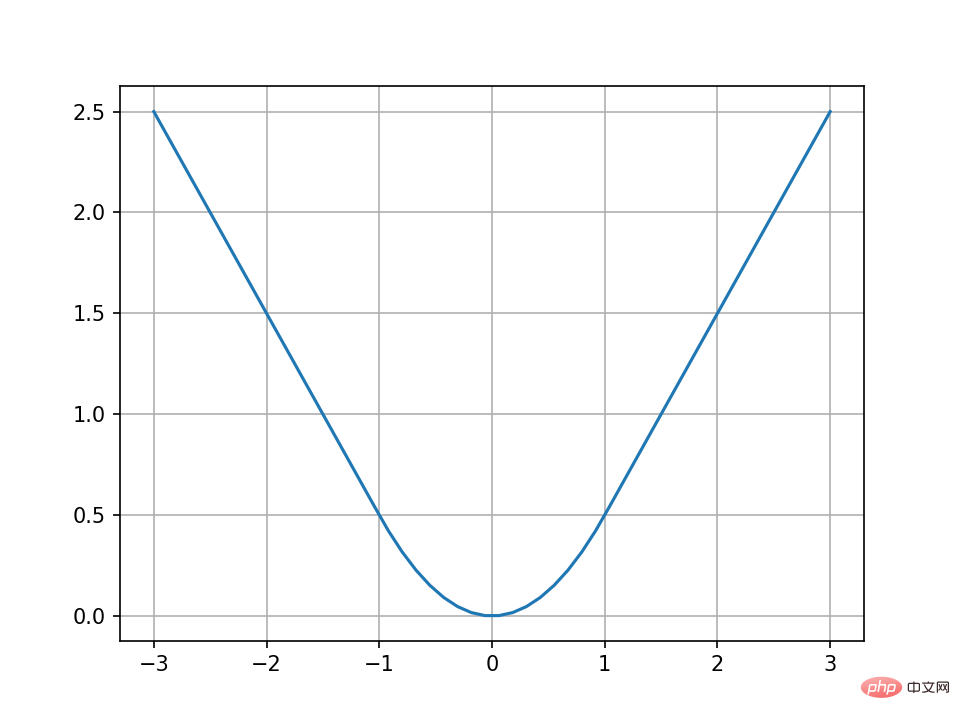
Die Details sind wie folgt:

Wie zeichne ich die stückweise Funktion, wie im Bild oben gezeigt, in Python?
import matplotlib.pyplot as plt
import numpy as np
def f(x):
    if x <= -1:
        return -0.5 - x
    if -1 < x <= 1:
        return 0.5 * (x ** 2)
    else:
        return x - 0.5
x = np.linspace(-3, 3)
y = []
for i in x:
    y_1 = f(i)
    y.append(y_1)
plt.plot(x, y)
plt.grid()
plt.show()
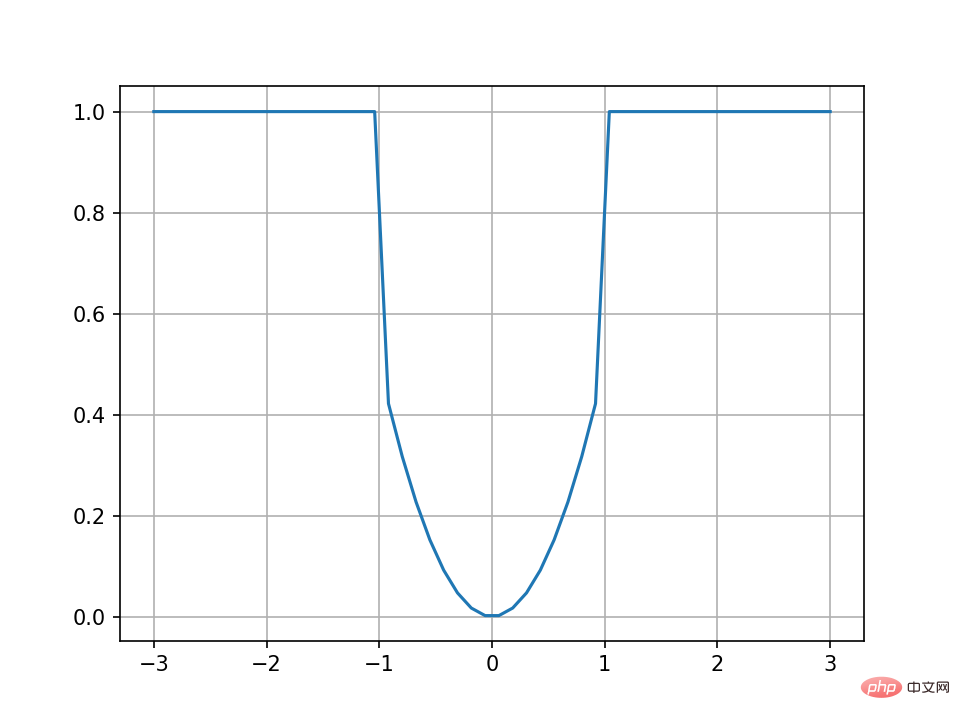
Ändern wir das Beispiel:
import matplotlib.pyplot as plt
import numpy as np
def f(x):
    if x <= -1:
        return 1
    if -1 < x <= 1:
        return 0.5 * (x ** 2)
    else:
        return 1
x = np.linspace(-3, 3)
y = []
for i in x:
    y_1 = f(i)
    y.append(y_1)
y_2 = x ** 2
plt.plot(x, y)
plt.grid()
plt.show()Das Ergebnis wird angezeigt als:

Das obige ist der detaillierte Inhalt vonSo zeichnen Sie stückweise Funktionen mit Python auf. Für weitere Informationen folgen Sie bitte anderen verwandten Artikeln auf der PHP chinesischen Website!


