 Backend-Entwicklung
 Python-Tutorial
 Grundlagen von Python Matplotlib: allgemeine Verwendung und Beispiele
Grundlagen von Python Matplotlib: allgemeine Verwendung und Beispiele
Matplotlib
Matplotlib ist ein Zeichentool ähnlich wie MATLAB in Python. Wenn Sie mit MATLAB vertraut sind, können Sie schnell mit Matplotlib beginnen.
1. Lernen Sie Matploblib kennen
1.1 Figure
Vor jeder Zeichnung benötigen wir ein Figure-Objekt, das so verstanden werden kann, wie wir es brauchen Zeichenbrett. Beginnen Sie mit dem Zeichnen.
import matplotlib.pyplot as plt
fig = plt.figure()
1.2 Achsen
Nachdem wir das Figure-Objekt haben, benötigen wir vor dem Zeichnen Achsen. Ohne Achsen gibt es keine Zeichnungsreferenz, daher müssen Achsen hinzugefügt werden. Es kann auch als Papier verstanden werden, das tatsächlich zum Zeichnen verwendet werden kann. Der Code auf
fig = plt.figure()
ax = fig.add_subplot(111)
ax.set(xlim=[0.5, 4.5], ylim=[-2, 8], title='An Example Axes',
       ylabel='Y-Axis', xlabel='X-Axis')
plt.show()fügt einem Bild eine Achse hinzu und legt dann den Wertebereich der X-Achse und der Y-Achse der Achsen fest (diese Einstellungen sind nicht obligatorisch und werden später besprochen). Über Diese Einstellungen) ist der Effekt wie folgt:
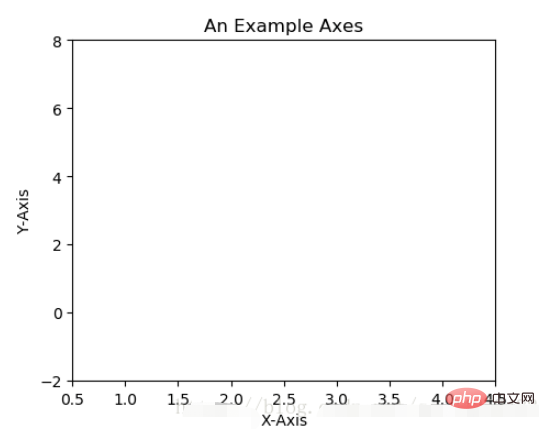
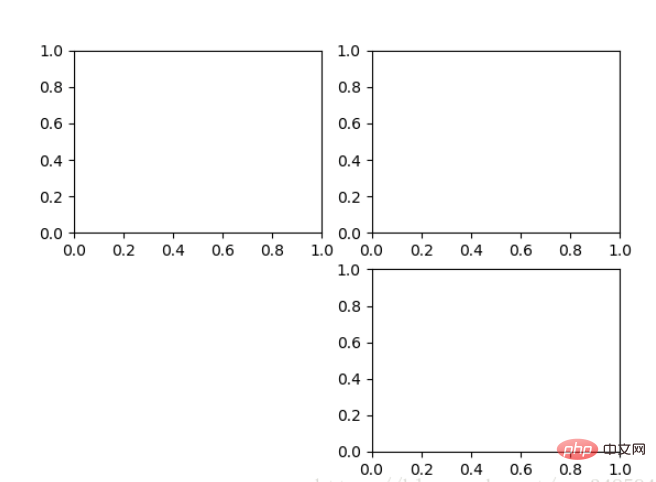
Für das obige fig.add_subplot(111) werden Achsen hinzugefügt , generiert die Parametererklärung ein Axes-Objekt an der ersten Position von Zeile 1 und Spalte 1 der Zeichenfläche, um das Malen vorzubereiten. Achsen können auch über fig.add_subplot(2, 2, 1) generiert werden. Die ersten beiden Parameter bestimmen die Aufteilung des Panels, z. B. 2. 2 teilt das gesamte Panel in 2 * 2 Quadrate .Gitter, der dritte Parameterwertebereich ist [1, 2*2] und gibt an, welche Achsen. Wie das folgende Beispiel: fig.add_subplot(111)就是添加Axes的,参数的解释的在画板的第1行第1列的第一个位置生成一个Axes对象来准备作画。也可以通过fig.add_subplot(2, 2, 1)的方式生成Axes,前面两个参数确定了面板的划分,例如 2, 2会将整个面板划分成 2 * 2 的方格,第三个参数取值范围是 [1, 2*2] 表示第几个Axes。如下面的例子:
fig = plt.figure()
ax1 = fig.add_subplot(221)
ax2 = fig.add_subplot(222)
ax3 = fig.add_subplot(224)
1.3 Multiple Axes
可以发现我们上面添加 Axes 似乎有点弱鸡,所以提供了下面的方式一次性生成所有 Axes:
fig, axes = plt.subplots(nrows=2, ncols=2)
axes[0,0].set(title='Upper Left')
axes[0,1].set(title='Upper Right')
axes[1,0].set(title='Lower Left')
axes[1,1].set(title='Lower Right')
fig 还是我们熟悉的画板, axes 成了我们常用二维数组的形式访问,这在循环绘图时,额外好用。
1.4 Axes Vs .pyplot
相信不少人看过下面的代码,很简单并易懂,但是下面的作画方式只适合简单的绘图,快速的将图绘出。在处理复杂的绘图工作时,我们还是需要使用 Axes 来完成作画的。
plt.plot([1, 2, 3, 4], [10, 20, 25, 30], color='lightblue', linewidth=3)
plt.xlim(0.5, 4.5)
plt.show()
2. 基本绘图2D
2.1 线
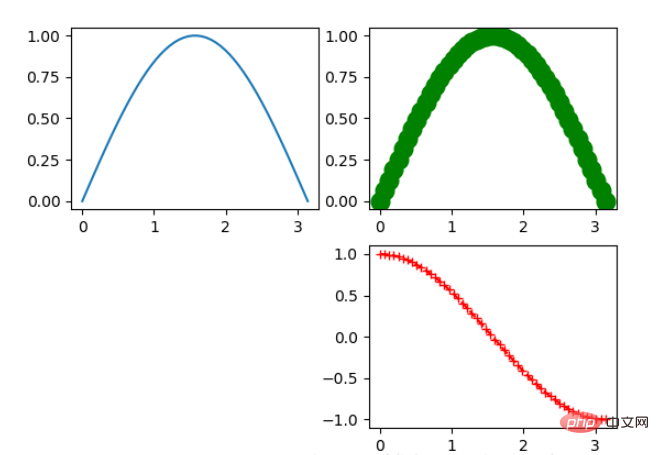
plot()函数画出一系列的点,并且用线将它们连接起来。看下例子:
x = np.linspace(0, np.pi)
y_sin = np.sin(x)
y_cos = np.cos(x)

ax1.plot(x, y_sin)
ax2.plot(x, y_sin, 'go--', linewidth=2, markersize=12)
ax3.plot(x, y_cos, color='red', marker='+', linestyle='dashed')
在上面的三个Axes上作画。plot,前面两个参数为x轴、y轴数据。ax2的第三个参数是 MATLAB风格的绘图,对应ax3上的颜色,marker,线型。
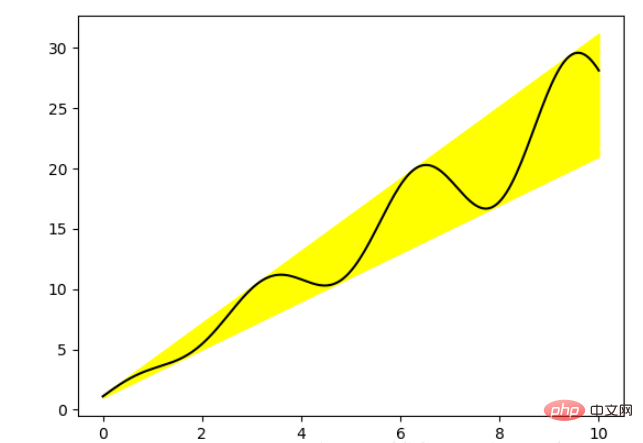
另外,我们可以通过关键字参数的方式绘图,如下例:
x = np.linspace(0, 10, 200)
data_obj = {'x': x,
            'y1': 2 * x + 1,
            'y2': 3 * x + 1.2,
            'mean': 0.5 * x * np.cos(2*x) + 2.5 * x + 1.1}

fig, ax = plt.subplots()

#填充两条线之间的颜色
ax.fill_between('x', 'y1', 'y2', color='yellow', data=data_obj)

# Plot the "centerline" with `plot`
ax.plot('x', 'mean', color='black', data=data_obj)

plt.show()发现上面的作图,在数据部分只传入了字符串,这些字符串对一个这 data_obj 中的关键字,当以这种方式作画时,将会在传入给 data 中寻找对应关键字的数据来绘图。
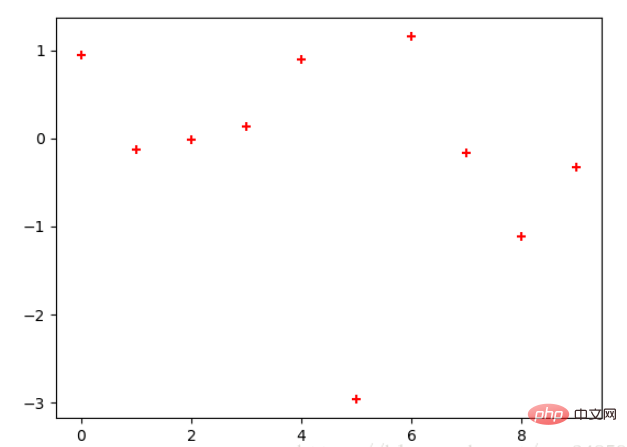
2.2 散点图
只画点,但是不用线连接起来。
x = np.arange(10)
y = np.random.randn(10)
plt.scatter(x, y, color='red', marker='+')
plt.show()
2.3 条形图
条形图分两种,一种是水平的,一种是垂直的,见下例子:
np.random.seed(1)
x = np.arange(5)
y = np.random.randn(5)

fig, axes = plt.subplots(ncols=2, figsize=plt.figaspect(1./2))

vert_bars = axes[0].bar(x, y, color='lightblue', align='center')
horiz_bars = axes[1].barh(x, y, color='lightblue', align='center')
#在水平或者垂直方向上画线
axes[0].axhline(0, color='gray', linewidth=2)
axes[1].axvline(0, color='gray', linewidth=2)
plt.show()
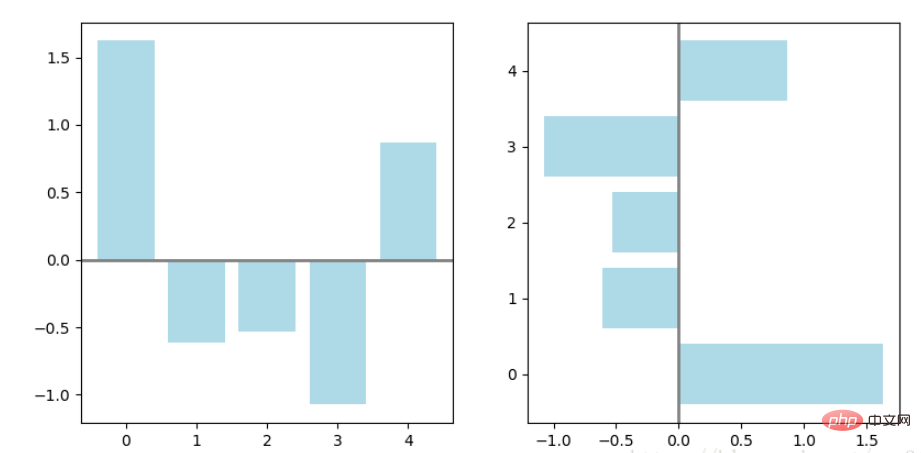
条形图还返回了一个Artists 数组,对应着每个条形,例如上图 Artists 数组的大小为5,我们可以通过这些 Artists 对条形图的样式进行更改,如下例:
fig, ax = plt.subplots()
vert_bars = ax.bar(x, y, color='lightblue', align='center')
# We could have also done this with two separate calls to `ax.bar` and numpy boolean indexing.
for bar, height in zip(vert_bars, y):
if height < 0:
bar.set(edgecolor='darkred', color='salmon', linewidth=3)
plt.show()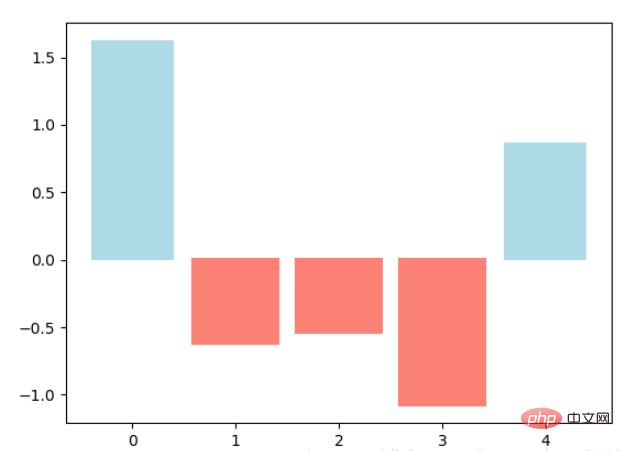
2.4 直方图
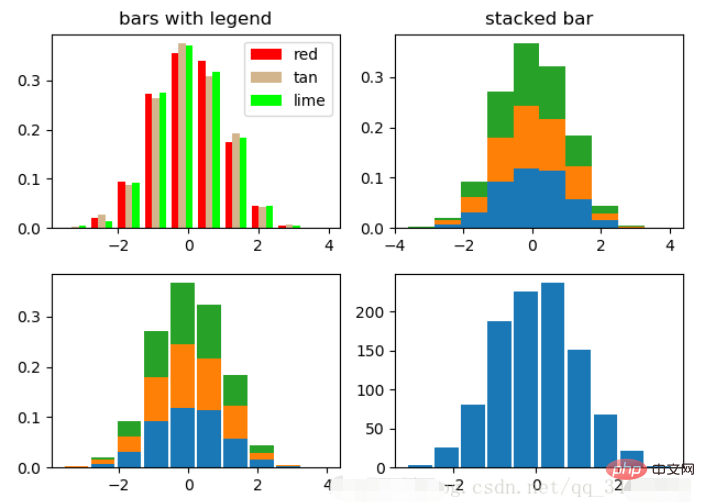
直方图用于统计数据出现的次数或者频率,有多种参数可以调整,见下例:
np.random.seed(19680801)

n_bins = 10
x = np.random.randn(1000, 3)

fig, axes = plt.subplots(nrows=2, ncols=2)
ax0, ax1, ax2, ax3 = axes.flatten()

colors = ['red', 'tan', 'lime']
ax0.hist(x, n_bins, density=True, histtype='bar', color=colors, label=colors)
ax0.legend(prop={'size': 10})
ax0.set_title('bars with legend')

ax1.hist(x, n_bins, density=True, histtype='barstacked')
ax1.set_title('stacked bar')

ax2.hist(x,  histtype='barstacked', rwidth=0.9)

ax3.hist(x[:, 0], rwidth=0.9)
ax3.set_title('different sample sizes')

fig.tight_layout()
plt.show()参数中density控制Y轴是概率还是数量,与返回的第一个的变量对应。histtype控制着直方图的样式,默认是 ‘bar’,对于多个条形时就相邻的方式呈现如子图1, ‘barstacked’ 就是叠在一起,如子图2、3。 rwidth 控制着宽度,这样可以空出一些间隙,比较图2、3. 图4是只有一条数据时。
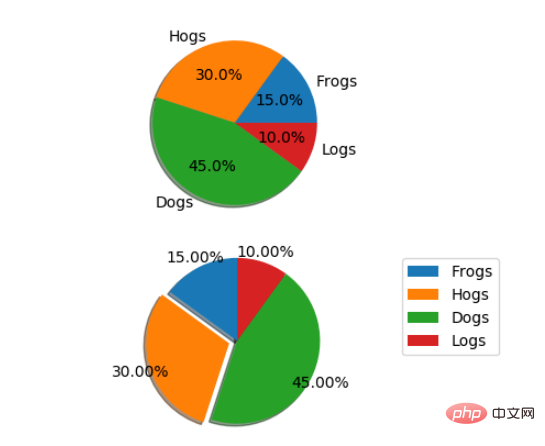
2.5 饼图
labels = 'Frogs', 'Hogs', 'Dogs', 'Logs'
sizes = [15, 30, 45, 10]
explode = (0, 0.1, 0, 0)  # only "explode" the 2nd slice (i.e. 'Hogs')

fig1, (ax1, ax2) = plt.subplots(2)
ax1.pie(sizes, labels=labels, autopct='%1.1f%%', shadow=True)
ax1.axis('equal')
ax2.pie(sizes, autopct='%1.2f%%', shadow=True, startangle=90, explode=explode,
    pctdistance=1.12)
ax2.axis('equal')
ax2.legend(labels=labels, loc='upper right')

plt.show()饼图自动根据数据的百分比画饼.。labels是各个块的标签,如子图一。autopct=%1.1f%%表示格式化百分比精确输出,explode,突出某些块,不同的值突出的效果不一样。pctdistance=1.12
fig, (ax1, ax2) = plt.subplots(2)
ax1.boxplot(data)
ax2.boxplot(data2, vert=False) #控制方向

 1.3 Mehrere Achsen
np.random.seed(19680801)


N = 50
x = np.random.rand(N)
y = np.random.rand(N)
colors = np.random.rand(N)
area = (30 * np.random.rand(N))**2  # 0 to 15 point radii

plt.scatter(x, y, s=area, c=colors, alpha=0.5)
plt.show()
fig, (ax1, ax2) = plt.subplots(2)
x = np.arange(-5, 5, 0.1)
y = np.arange(-5, 5, 0.1)
xx, yy = np.meshgrid(x, y, sparse=True)
z = np.sin(xx**2 + yy**2) / (xx**2 + yy**2)
ax1.contourf(x, y, z)
ax2.contour(x, y, z)
ax.set_xlim([xmin, xmax])   #设置X轴的区间
ax.set_ylim([ymin, ymax])   #Y轴区间
ax.axis([xmin, xmax, ymin, ymax])   #X、Y轴区间
ax.set_ylim(bottom=-10)     #Y轴下限
ax.set_xlim(right=25)       #X轴上限
 # 🎜🎜##🎜🎜#Darüber hinaus können wir nach Schlüsselwortparametern zeichnen, wie im folgenden Beispiel: #🎜🎜#
x = np.linspace(0, 2*np.pi)
y = np.sin(x)
fig, (ax1, ax2) = plt.subplots(2)
ax1.plot(x, y)
ax2.plot(x, y)
ax2.set_xlim([-1, 6])
ax2.set_ylim([-1, 3])
plt.show()
 # 🎜🎜##🎜🎜#2.2 Streudiagramm#🎜🎜##🎜🎜#Nur Punkte zeichnen, aber nicht mit Linien verbinden. #🎜🎜#
fig, ax = plt.subplots()
ax.plot([1, 2, 3, 4], [10, 20, 25, 30], label='Philadelphia')
ax.plot([1, 2, 3, 4], [30, 23, 13, 4], label='Boston')
ax.scatter([1, 2, 3, 4], [20, 10, 30, 15], label='Point')
ax.set(ylabel='Temperature (deg C)', xlabel='Time', title='A tale of two cities')
ax.legend()
plt.show()
 #🎜🎜##🎜🎜#2.3 Balkendiagramm#🎜🎜##🎜🎜#Es gibt zwei Arten von Balkendiagrammen, eines ist horizontal und das andere vertikal, siehe Beispiel unten: #🎜🎜#
data = [('apples', 2), ('oranges', 3), ('peaches', 1)]
fruit, value = zip(*data)

fig, (ax1, ax2) = plt.subplots(2)
x = np.arange(len(fruit))
ax1.bar(x, value, align='center', color='gray')
ax2.bar(x, value, align='center', color='gray')

ax2.set(xticks=x, xticklabels=fruit)

#ax.tick_params(axis='y', direction='inout', length=10) #修改 ticks 的方向以及长度
plt.show()
 #🎜🎜## 🎜🎜 #Das Balkendiagramm gibt auch ein Künstler-Array zurück, das jedem Balken entspricht. Die Größe des Künstler-Arrays im obigen Bild beträgt beispielsweise 5. Wir können den Stil des Balkendiagramms über diese Künstler ändern, wie im Folgenden Beispiel: #🎜🎜#
fig, axes = plt.subplots(2, 2, figsize=(9, 9))
fig.subplots_adjust(wspace=0.5, hspace=0.3,
                    left=0.125, right=0.9,
                    top=0.9,    bottom=0.1)

#fig.tight_layout() #自动调整布局,使标题之间不重叠
plt.show() #🎜🎜## 🎜🎜#2.4 Histogramm#🎜🎜##🎜🎜#Das Histogramm wird verwendet, um die Anzahl oder Häufigkeit des Auftretens von Daten zu zählen. Es gibt viele Parameter, die angepasst werden können, siehe das Beispiel unten: #🎜🎜#
fig, (ax1, ax2) = plt.subplots(1, 2, sharex=True, sharey=True)
ax1.plot([1, 2, 3, 4], [1, 2, 3, 4])
ax2.plot([3, 4, 5, 6], [6, 5, 4, 3])
plt.show()
density steuert, ob die Y-Achse eine Wahrscheinlichkeit oder eine Menge ist, entsprechend der ersten zurückgegebenen Variablen. histtype steuert den Stil des Histogramms. Bei mehreren Balken werden diese nebeneinander angezeigt, wie in Unterdiagramm 1 gezeigt Unterabsatz 1. Abbildungen 2 und 3. rwidth steuert die Breite, wodurch einige Lücken entstehen können. Vergleichen Sie die Abbildungen 2 und 3. In Abbildung 4 ist nur ein Datenelement vorhanden. #🎜🎜##🎜🎜# # 🎜🎜##🎜🎜#2.5 Kreisdiagramm#🎜🎜#
fig, ax = plt.subplots()
ax.plot([-2, 2, 3, 4], [-10, 20, 25, 5])
ax.spines['top'].set_visible(False)     #顶边界不可见
ax.xaxis.set_ticks_position('bottom')  # ticks 的位置为下方,分上下的。
ax.spines['right'].set_visible(False)   #右边界不可见
ax.yaxis.set_ticks_position('left')

# "outward"
# 移动左、下边界离 Axes 10 个距离
#ax.spines['bottom'].set_position(('outward', 10))
#ax.spines['left'].set_position(('outward', 10))

# "data"
# 移动左、下边界到 (0, 0) 处相交
ax.spines['bottom'].set_position(('data', 0))
ax.spines['left'].set_position(('data', 0))

# "axes"
# 移动边界,按 Axes 的百分比位置
#ax.spines['bottom'].set_position(('axes', 0.75))
#ax.spines['left'].set_position(('axes', 0.3))

plt.show()
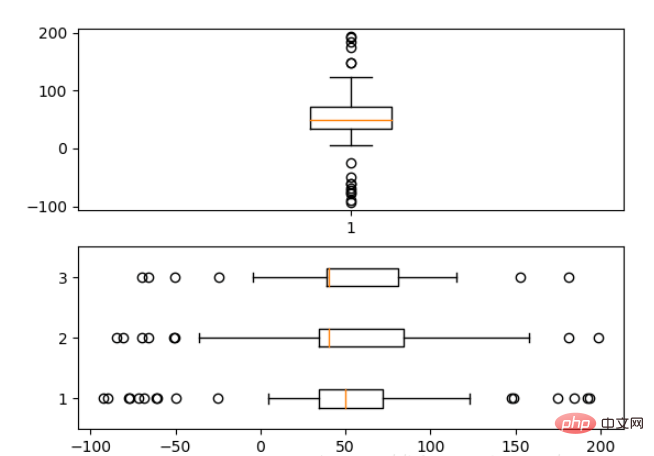
labels ist die Beschriftung jedes Blocks, z. B. Unterbild 1. autopct=%1.1f%% bedeutet, dass die formatierte prozentuale Ausgabe bestimmte Blöcke hervorhebt. pctdistance=1.12Der Abstand zwischen dem Prozentsatz und dem Mittelpunkt des Kreises, der Standardwert ist 0,6.#🎜🎜##🎜🎜##🎜🎜##🎜🎜#2.6 箱形图
为了专注于如何画图,省去数据的处理部分。 data 的 shape 为 (n, ), data2 的 shape 为 (n, 3)。
fig, (ax1, ax2) = plt.subplots(2)
ax1.boxplot(data)
ax2.boxplot(data2, vert=False) #控制方向
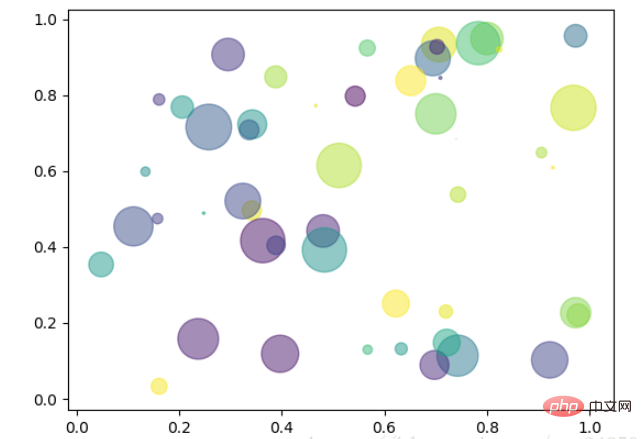
2.7 泡泡图
散点图的一种,加入了第三个值 s 可以理解成普通散点,画的是二维,泡泡图体现了Z的大小,如下例:
np.random.seed(19680801)


N = 50
x = np.random.rand(N)
y = np.random.rand(N)
colors = np.random.rand(N)
area = (30 * np.random.rand(N))**2  # 0 to 15 point radii

plt.scatter(x, y, s=area, c=colors, alpha=0.5)
plt.show()
2.8 等高线(轮廓图)
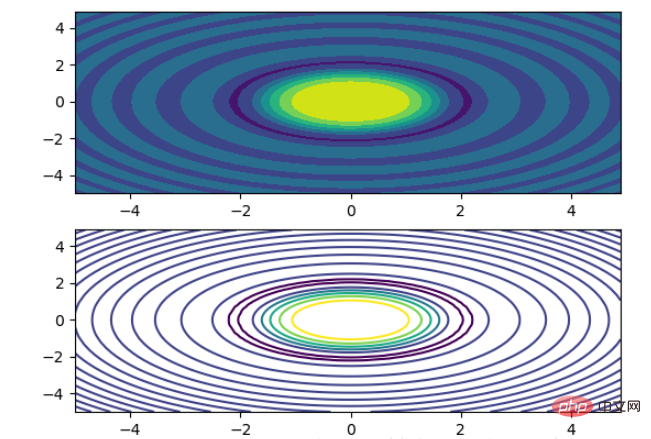
有时候需要描绘边界的时候,就会用到轮廓图,机器学习用的决策边界也常用轮廓图来绘画,见下例:
fig, (ax1, ax2) = plt.subplots(2)
x = np.arange(-5, 5, 0.1)
y = np.arange(-5, 5, 0.1)
xx, yy = np.meshgrid(x, y, sparse=True)
z = np.sin(xx**2 + yy**2) / (xx**2 + yy**2)
ax1.contourf(x, y, z)
ax2.contour(x, y, z)
上面画了两个一样的轮廓图,contourf会填充轮廓线之间的颜色。数据x, y, z通常是具有相同 shape 的二维矩阵。x, y 可以为一维向量,但是必需有 z.shape = (y.n, x.n) ,这里 y.n 和 x.n 分别表示x、y的长度。Z通常表示的是距离X-Y平面的距离,传入X、Y则是控制了绘制等高线的范围。
3 布局、图例说明、边界等
3.1区间上下限
当绘画完成后,会发现X、Y轴的区间是会自动调整的,并不是跟我们传入的X、Y轴数据中的最值相同。为了调整区间我们使用下面的方式:
ax.set_xlim([xmin, xmax])   #设置X轴的区间
ax.set_ylim([ymin, ymax])   #Y轴区间
ax.axis([xmin, xmax, ymin, ymax])   #X、Y轴区间
ax.set_ylim(bottom=-10)     #Y轴下限
ax.set_xlim(right=25)       #X轴上限
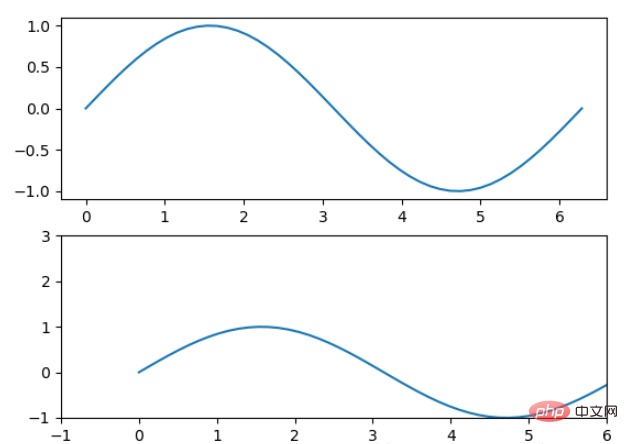
具体效果见下例:
x = np.linspace(0, 2*np.pi)
y = np.sin(x)
fig, (ax1, ax2) = plt.subplots(2)
ax1.plot(x, y)
ax2.plot(x, y)
ax2.set_xlim([-1, 6])
ax2.set_ylim([-1, 3])
plt.show()
可以看出修改了区间之后影响了图片显示的效果。
3.2 图例说明
我们如果我们在一个Axes上做多次绘画,那么可能出现分不清哪条线或点所代表的意思。这个时间添加图例说明,就可以解决这个问题了,见下例:
fig, ax = plt.subplots()
ax.plot([1, 2, 3, 4], [10, 20, 25, 30], label='Philadelphia')
ax.plot([1, 2, 3, 4], [30, 23, 13, 4], label='Boston')
ax.scatter([1, 2, 3, 4], [20, 10, 30, 15], label='Point')
ax.set(ylabel='Temperature (deg C)', xlabel='Time', title='A tale of two cities')
ax.legend()
plt.show()
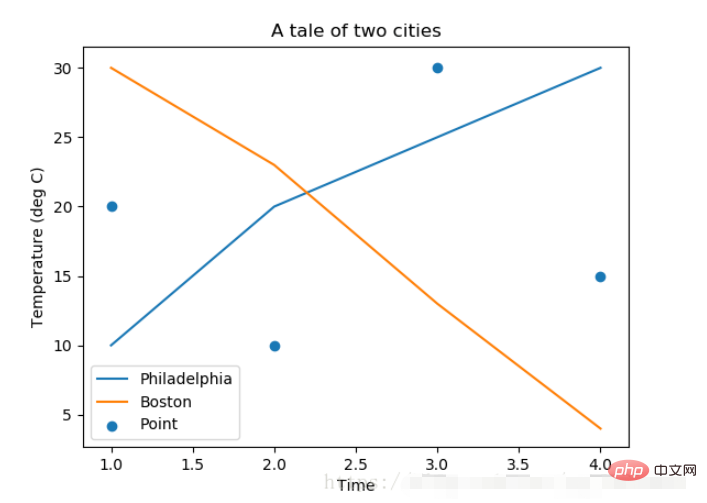
在绘图时传入 label 参数,并最后调用ax.legend()显示体力说明,对于 legend 还是传入参数,控制图例说明显示的位置:
| Location String | Location Code |
|---|---|
| ‘best’ | 0 |
| ‘upper right’ | 1 |
| ‘upper left’ | 2 |
| ‘lower left’ | 3 |
| ‘lower right’ | 4 |
| ‘right’ | 5 |
| ‘center left’ | 6 |
| ‘center right’ | 7 |
| ‘lower center’ | 8 |
| ‘upper center’ | 9 |
| ‘center’ | 10 |
3.3 区间分段
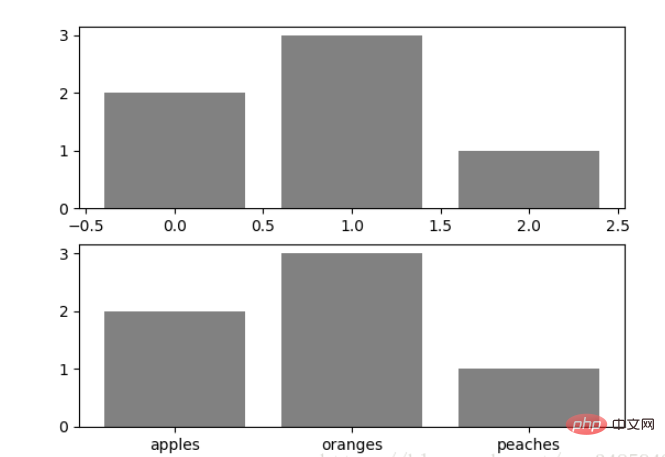
默认情况下,绘图结束之后,Axes 会自动的控制区间的分段。见下例:
data = [('apples', 2), ('oranges', 3), ('peaches', 1)]
fruit, value = zip(*data)

fig, (ax1, ax2) = plt.subplots(2)
x = np.arange(len(fruit))
ax1.bar(x, value, align='center', color='gray')
ax2.bar(x, value, align='center', color='gray')

ax2.set(xticks=x, xticklabels=fruit)

#ax.tick_params(axis='y', direction='inout', length=10) #修改 ticks 的方向以及长度
plt.show()
上面不仅修改了X轴的区间段,并且修改了显示的信息为文本。
3.4 布局
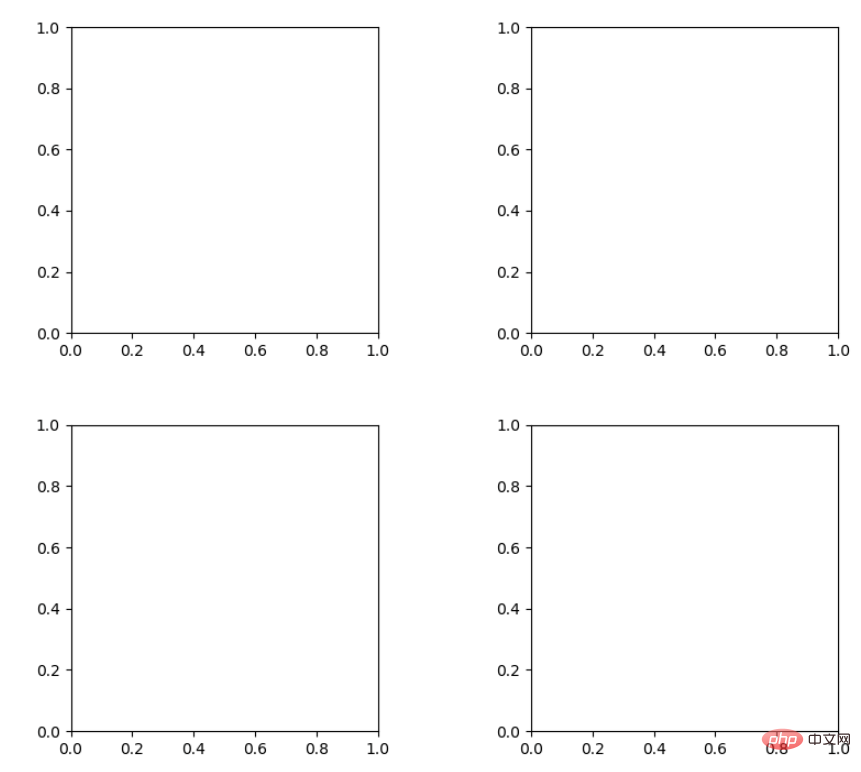
当我们绘画多个子图时,就会有一些美观的问题存在,例如子图之间的间隔,子图与画板的外边间距以及子图的内边距,下面说明这个问题:
fig, axes = plt.subplots(2, 2, figsize=(9, 9))
fig.subplots_adjust(wspace=0.5, hspace=0.3,
                    left=0.125, right=0.9,
                    top=0.9,    bottom=0.1)

#fig.tight_layout() #自动调整布局,使标题之间不重叠
plt.show()通过fig.subplots_adjust()我们修改了子图水平之间的间隔wspace=0.5,垂直方向上的间距hspace=0.3,左边距left=0.125 等等,这里数值都是百分比的。以 [0, 1] 为区间,选择left、right、bottom、top 注意 top 和 right 是 0.9 表示上、右边距为百分之10。不确定如果调整的时候,fig.tight_layout()是一个很好的选择。之前说到了内边距,内边距是子图的,也就是 Axes 对象,所以这样使用 ax.margins(x=0.1, y=0.1),当值传入一个值时,表示同时修改水平和垂直方向的内边距。
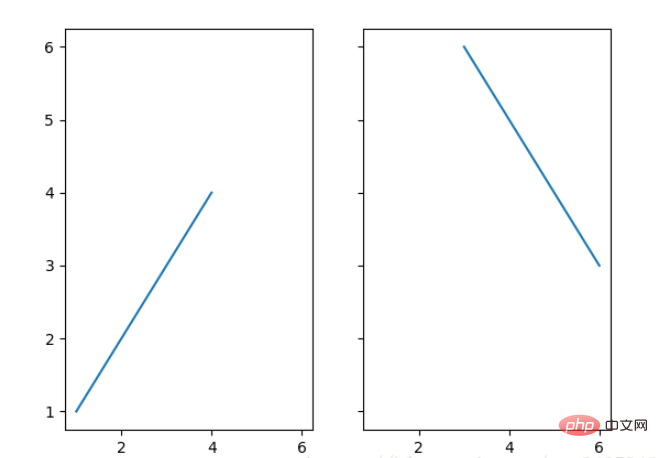
观察上面的四个子图,可以发现他们的X、Y的区间是一致的,而且这样显示并不美观,所以可以调整使他们使用一样的X、Y轴:
fig, (ax1, ax2) = plt.subplots(1, 2, sharex=True, sharey=True)
ax1.plot([1, 2, 3, 4], [1, 2, 3, 4])
ax2.plot([3, 4, 5, 6], [6, 5, 4, 3])
plt.show()
3.5 轴相关
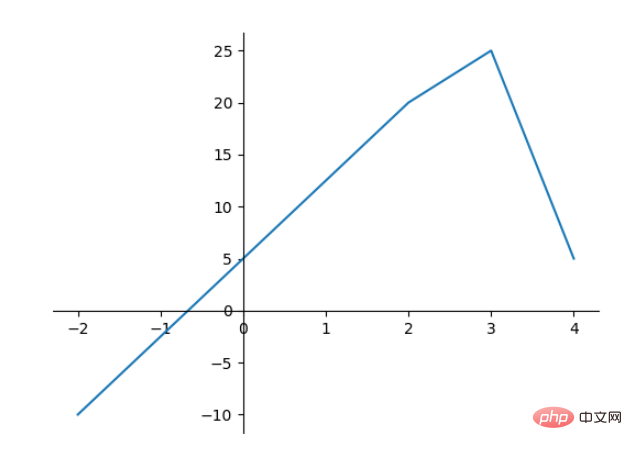
改变边界的位置,去掉四周的边框:
fig, ax = plt.subplots()
ax.plot([-2, 2, 3, 4], [-10, 20, 25, 5])
ax.spines['top'].set_visible(False)     #顶边界不可见
ax.xaxis.set_ticks_position('bottom')  # ticks 的位置为下方,分上下的。
ax.spines['right'].set_visible(False)   #右边界不可见
ax.yaxis.set_ticks_position('left')

# "outward"
# 移动左、下边界离 Axes 10 个距离
#ax.spines['bottom'].set_position(('outward', 10))
#ax.spines['left'].set_position(('outward', 10))

# "data"
# 移动左、下边界到 (0, 0) 处相交
ax.spines['bottom'].set_position(('data', 0))
ax.spines['left'].set_position(('data', 0))

# "axes"
# 移动边界,按 Axes 的百分比位置
#ax.spines['bottom'].set_position(('axes', 0.75))
#ax.spines['left'].set_position(('axes', 0.3))

plt.show()
Das obige ist der detaillierte Inhalt vonGrundlagen von Python Matplotlib: allgemeine Verwendung und Beispiele. Für weitere Informationen folgen Sie bitte anderen verwandten Artikeln auf der PHP chinesischen Website!

Heiße KI -Werkzeuge

Undresser.AI Undress
KI-gestützte App zum Erstellen realistischer Aktfotos

AI Clothes Remover
Online-KI-Tool zum Entfernen von Kleidung aus Fotos.

Undress AI Tool
Ausziehbilder kostenlos

Clothoff.io
KI-Kleiderentferner

AI Hentai Generator
Erstellen Sie kostenlos Ai Hentai.

Heißer Artikel

Heiße Werkzeuge

Notepad++7.3.1
Einfach zu bedienender und kostenloser Code-Editor

SublimeText3 chinesische Version
Chinesische Version, sehr einfach zu bedienen

Senden Sie Studio 13.0.1
Leistungsstarke integrierte PHP-Entwicklungsumgebung

Dreamweaver CS6
Visuelle Webentwicklungstools

SublimeText3 Mac-Version
Codebearbeitungssoftware auf Gottesniveau (SublimeText3)

Heiße Themen
 1377
1377
 52
52
 Muss MySQL bezahlen?
Apr 08, 2025 pm 05:36 PM
MySQL hat eine kostenlose Community -Version und eine kostenpflichtige Enterprise -Version. Die Community -Version kann kostenlos verwendet und geändert werden, die Unterstützung ist jedoch begrenzt und für Anwendungen mit geringen Stabilitätsanforderungen und starken technischen Funktionen geeignet. Die Enterprise Edition bietet umfassende kommerzielle Unterstützung für Anwendungen, die eine stabile, zuverlässige Hochleistungsdatenbank erfordern und bereit sind, Unterstützung zu bezahlen. Zu den Faktoren, die bei der Auswahl einer Version berücksichtigt werden, gehören Kritikalität, Budgetierung und technische Fähigkeiten von Anwendungen. Es gibt keine perfekte Option, nur die am besten geeignete Option, und Sie müssen die spezifische Situation sorgfältig auswählen.
 So verwenden Sie MySQL nach der Installation
Apr 08, 2025 am 11:48 AM
Der Artikel führt den Betrieb der MySQL -Datenbank vor. Zunächst müssen Sie einen MySQL -Client wie MySQLworkBench oder Befehlszeilen -Client installieren. 1. Verwenden Sie den Befehl mySQL-uroot-P, um eine Verbindung zum Server herzustellen und sich mit dem Stammkonto-Passwort anzumelden. 2. Verwenden Sie die Erstellung von Createdatabase, um eine Datenbank zu erstellen, und verwenden Sie eine Datenbank aus. 3.. Verwenden Sie CreateTable, um eine Tabelle zu erstellen, Felder und Datentypen zu definieren. 4. Verwenden Sie InsertInto, um Daten einzulegen, Daten abzufragen, Daten nach Aktualisierung zu aktualisieren und Daten nach Löschen zu löschen. Nur indem Sie diese Schritte beherrschen, lernen, mit gemeinsamen Problemen umzugehen und die Datenbankleistung zu optimieren, können Sie MySQL effizient verwenden.
 MySQL kann nach dem Herunterladen nicht installiert werden
Apr 08, 2025 am 11:24 AM
Die Hauptgründe für den Fehler bei MySQL -Installationsfehlern sind: 1. Erlaubnisprobleme, Sie müssen als Administrator ausgeführt oder den Sudo -Befehl verwenden. 2. Die Abhängigkeiten fehlen, und Sie müssen relevante Entwicklungspakete installieren. 3. Portkonflikte müssen Sie das Programm schließen, das Port 3306 einnimmt, oder die Konfigurationsdatei ändern. 4. Das Installationspaket ist beschädigt. Sie müssen die Integrität herunterladen und überprüfen. 5. Die Umgebungsvariable ist falsch konfiguriert und die Umgebungsvariablen müssen korrekt entsprechend dem Betriebssystem konfiguriert werden. Lösen Sie diese Probleme und überprüfen Sie jeden Schritt sorgfältig, um MySQL erfolgreich zu installieren.
 Die MySQL -Download -Datei ist beschädigt und kann nicht installiert werden. Reparaturlösung
Apr 08, 2025 am 11:21 AM
Die MySQL -Download -Datei ist beschädigt. Was soll ich tun? Wenn Sie MySQL herunterladen, können Sie die Korruption der Datei begegnen. Es ist heutzutage wirklich nicht einfach! In diesem Artikel wird darüber gesprochen, wie dieses Problem gelöst werden kann, damit jeder Umwege vermeiden kann. Nach dem Lesen können Sie nicht nur das beschädigte MySQL -Installationspaket reparieren, sondern auch ein tieferes Verständnis des Download- und Installationsprozesses haben, um zu vermeiden, dass Sie in Zukunft stecken bleiben. Lassen Sie uns zunächst darüber sprechen, warum das Herunterladen von Dateien beschädigt wird. Dafür gibt es viele Gründe. Netzwerkprobleme sind der Schuldige. Unterbrechung des Download -Prozesses und der Instabilität im Netzwerk kann zu einer Korruption von Dateien führen. Es gibt auch das Problem mit der Download -Quelle selbst. Die Serverdatei selbst ist gebrochen und natürlich auch unterbrochen, wenn Sie sie herunterladen. Darüber hinaus kann das übermäßige "leidenschaftliche" Scannen einer Antiviren -Software auch zu einer Beschädigung von Dateien führen. Diagnoseproblem: Stellen Sie fest, ob die Datei wirklich beschädigt ist
 Wie optimieren Sie die MySQL-Leistung für Hochlastanwendungen?
Apr 08, 2025 pm 06:03 PM
Die MySQL-Datenbankleistung Optimierungshandbuch In ressourcenintensiven Anwendungen spielt die MySQL-Datenbank eine entscheidende Rolle und ist für die Verwaltung massiver Transaktionen verantwortlich. Mit der Erweiterung der Anwendung werden jedoch die Datenbankleistung Engpässe häufig zu einer Einschränkung. In diesem Artikel werden eine Reihe effektiver Strategien zur Leistungsoptimierung von MySQL -Leistung untersucht, um sicherzustellen, dass Ihre Anwendung unter hohen Lasten effizient und reaktionsschnell bleibt. Wir werden tatsächliche Fälle kombinieren, um eingehende Schlüsseltechnologien wie Indexierung, Abfrageoptimierung, Datenbankdesign und Caching zu erklären. 1. Das Design der Datenbankarchitektur und die optimierte Datenbankarchitektur sind der Eckpfeiler der MySQL -Leistungsoptimierung. Hier sind einige Kernprinzipien: Die Auswahl des richtigen Datentyps und die Auswahl des kleinsten Datentyps, der den Anforderungen entspricht, kann nicht nur Speicherplatz speichern, sondern auch die Datenverarbeitungsgeschwindigkeit verbessern.
 So optimieren Sie die Datenbankleistung nach der MySQL -Installation
Apr 08, 2025 am 11:36 AM
Die MySQL -Leistungsoptimierung muss von drei Aspekten beginnen: Installationskonfiguration, Indexierung und Abfrageoptimierung, Überwachung und Abstimmung. 1. Nach der Installation müssen Sie die my.cnf -Datei entsprechend der Serverkonfiguration anpassen, z. 2. Erstellen Sie einen geeigneten Index, um übermäßige Indizes zu vermeiden und Abfrageanweisungen zu optimieren, z. B. den Befehl Erklärung zur Analyse des Ausführungsplans; 3. Verwenden Sie das eigene Überwachungstool von MySQL (ShowProcessList, Showstatus), um die Datenbankgesundheit zu überwachen und die Datenbank regelmäßig zu sichern und zu organisieren. Nur durch kontinuierliche Optimierung dieser Schritte kann die Leistung der MySQL -Datenbank verbessert werden.
 Braucht MySQL das Internet?
Apr 08, 2025 pm 02:18 PM
MySQL kann ohne Netzwerkverbindungen für die grundlegende Datenspeicherung und -verwaltung ausgeführt werden. Für die Interaktion mit anderen Systemen, Remotezugriff oder Verwendung erweiterte Funktionen wie Replikation und Clustering ist jedoch eine Netzwerkverbindung erforderlich. Darüber hinaus sind Sicherheitsmaßnahmen (wie Firewalls), Leistungsoptimierung (Wählen Sie die richtige Netzwerkverbindung) und die Datensicherung für die Verbindung zum Internet von entscheidender Bedeutung.
 Navicat -Methode zum Anzeigen von MongoDB -Datenbankkennwort
Apr 08, 2025 pm 09:39 PM
Es ist unmöglich, das MongoDB -Passwort direkt über Navicat anzuzeigen, da es als Hash -Werte gespeichert ist. So rufen Sie verlorene Passwörter ab: 1. Passwörter zurücksetzen; 2. Überprüfen Sie die Konfigurationsdateien (können Hash -Werte enthalten). 3. Überprüfen Sie Codes (May Hardcode -Passwörter).


