 Backend-Entwicklung
 Python-Tutorial
 Wie implementiert man die Gantt-Diagrammzeichnung in Python?
Wie implementiert man die Gantt-Diagrammzeichnung in Python?
前期准备
因为我们这次需要用到streamlit、streamlit-aggrid以及plotly模块,先通过pip命令将这些模块下载下来,其中streamlit-aggrid主要是将数据表能够呈现在页面上
pip install streamlit-aggrid
pip install plotly
页面的结构
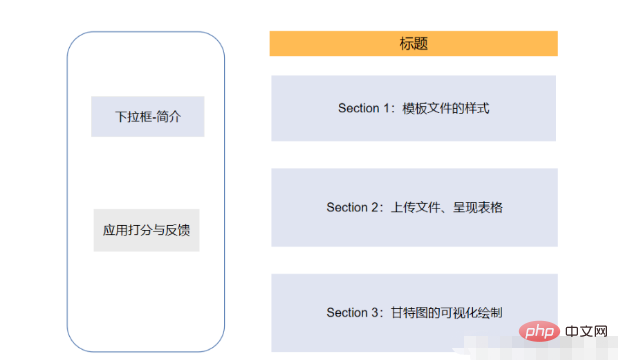
整体页面的结构是左边有一个工具栏,包含了该网页的一些简短介绍、以及一个希望使用者评分和反馈的模块
而右边则的Section1是项目规划文件的模板样式,主要是在CSV文件当中写清楚任务的细节,包括任务名称、任务描述、开始与结束时间等等内容。Section2则是允许用户上传自己的CSV文件,修改CSV文件中项目的内容以及一个可视化的呈现,而Section3则是将上述的内容导出至HTML文件当中去
代码部分
下面便是该页面的代码部分
from st_aggrid import AgGrid
import streamlit as st
import pandas as pd
import numpy as np
import plotly.express as px
from  PIL import Image
import io
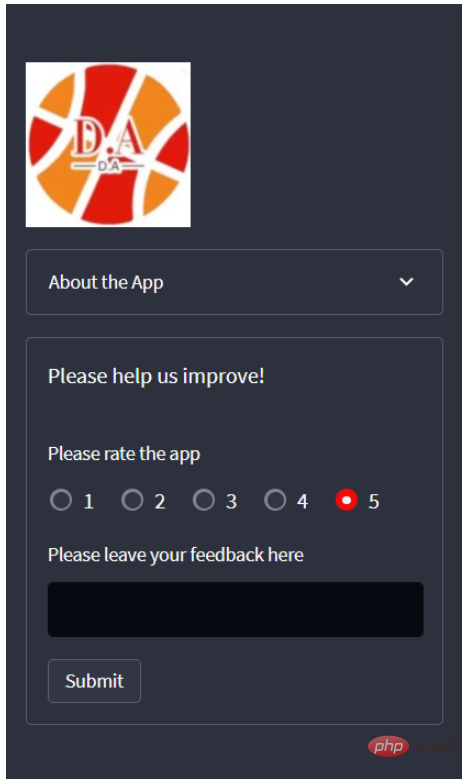
接下来我们针对左边工具栏的部分进行一个开发,主要是对该页面进行一个简单的介绍以及评分等功能
logo = Image.open(r'wechat_logo.jpg')
st.sidebar.image(logo, width=120)
with st.sidebar.expander("关于此APP的功能"):
st.write("""
项目的简单介绍)
""")
with st.sidebar.form(key='columns_in_form',clear_on_submit=True):
st.write('反馈')
st.write('<style>div.row-widget.stRadio > div{flex-direction:row;} </style>', unsafe_allow_html=True) # 水平方向的按钮
rating=st.radio("打分",('1','2','3','4','5'),index=4)
text=st.text_input(label='反馈')
submitted = st.form_submit_button('提交')
if submitted:
st.write('感谢')
st.markdown('您的评分是:')
st.markdown(rating)
st.markdown('您的反馈是:')
st.markdown(text)结果如下图所示

主页面的开发-Section 1
接下去便是主页面的Section 1部分的开发,主要是展示项目CSV文件的样式,包含了哪些列、列名分别是什么等等,代码如下
st.markdown(""" <style> .font {
font-size:30px ; font-family: 'Cooper Black'; color: #FF9633;}
</style> """, unsafe_allow_html=True)
st.markdown('<p class="font">上传您的CSV文件</p>', unsafe_allow_html=True)
st.subheader('第一步:下载模板文件')
image = Image.open(r'example.png') # 模板文件的截图
st.image(image, caption='确保列名是一致的')
@st.cache_data
def convert_df(df):
return df.to_csv().encode('utf-8')
df=pd.read_csv(r'template.csv', encoding='gbk')
csv = convert_df(df)
st.download_button(
label="下载模板",
data=csv,
file_name='project_template.csv',
mime='text/csv',
)我们提供了下载按钮可以让用户一键下载模板文件,最后呈现的样子是这样的

主页页面的开发-Section 2
接下去便是上传我们自己的CSV文件,这里我们用到了streamlit_aggrid模块,该模块的好处就在于可以对数据表进行一个展示,并且可以对其中的数据进行修改,
st.subheader('Step 2: Upload your project plan file')
uploaded_file = st.file_uploader(
    "上传文件",
    type=['csv'])
if uploaded_file is not None:
    Tasks = pd.read_csv(uploaded_file, encoding='gbk')
    Tasks['Start'] = Tasks['Start'].astype('datetime64')
    Tasks['Finish'] = Tasks['Finish'].astype('datetime64')

    grid_response = AgGrid(
        Tasks,
        editable=True,
        height=300,
        width='100%',
    )

    updated = grid_response['data']
df = pd.DataFrame(updated)output

接下去便是对数据的可视化呈现了,这里是用Plotly模块来绘制甘特图,我们可以选择是以团队的维度来绘制或者是以项目完成的进度来绘制,代码如下
st.subheader('第三部:绘制甘特图')

Options = st.selectbox("以下面哪种维度来绘制甘特图:", ['Team', 'Completion Pct'], index=0)
if st.button('绘制甘特图'):
    fig = px.timeline(
        df,
        x_start="Start",
        x_end="Finish",
        y="Task",
        color=Options,
        hover_name="Task Description"
    )

    fig.update_yaxes(
        autorange="reversed")

    fig.update_layout(
        title='Project Plan Gantt Chart',
        bargap=0.2,
        height=600,
        xaxis_title="Date",
        yaxis_title="Project Name",
        title_x=0.5,
        xaxis=dict(
            tickfont_size=15,
            tickangle=270,
            rangeslider_visible=True,
            side="top",
            showgrid=True,
            zeroline=True,
            showline=True,
            showticklabels=True,
            tickformat="%x\n",
        )
    )

    fig.update_xaxes(tickangle=0, tickfont=dict(family='Rockwell', color='blue', size=15))
    st.plotly_chart(fig, use_container_width=True)  # 绘制甘特图至页面上
    st.subheader(
        'Bonus: 导出至HTML')
    buffer = io.StringIO()
    fig.write_html(buffer, include_plotlyjs='cdn')
    html_bytes = buffer.getvalue().encode()
    st.download_button(
        label='Export to HTML',
        data=html_bytes,
        file_name='Gantt.html',
        mime='text/html'
    )
else:
st.write('---')Das obige ist der detaillierte Inhalt vonWie implementiert man die Gantt-Diagrammzeichnung in Python?. Für weitere Informationen folgen Sie bitte anderen verwandten Artikeln auf der PHP chinesischen Website!

Heiße KI -Werkzeuge

Undresser.AI Undress
KI-gestützte App zum Erstellen realistischer Aktfotos

AI Clothes Remover
Online-KI-Tool zum Entfernen von Kleidung aus Fotos.

Undress AI Tool
Ausziehbilder kostenlos

Clothoff.io
KI-Kleiderentferner

AI Hentai Generator
Erstellen Sie kostenlos Ai Hentai.

Heißer Artikel

Heiße Werkzeuge

Notepad++7.3.1
Einfach zu bedienender und kostenloser Code-Editor

SublimeText3 chinesische Version
Chinesische Version, sehr einfach zu bedienen

Senden Sie Studio 13.0.1
Leistungsstarke integrierte PHP-Entwicklungsumgebung

Dreamweaver CS6
Visuelle Webentwicklungstools

SublimeText3 Mac-Version
Codebearbeitungssoftware auf Gottesniveau (SublimeText3)

Heiße Themen
 1371
1371
 52
52
 Was ist die Funktion der C -Sprachsumme?
Apr 03, 2025 pm 02:21 PM
Es gibt keine integrierte Summenfunktion in der C-Sprache, daher muss sie selbst geschrieben werden. Die Summe kann erreicht werden, indem das Array durchquert und Elemente akkumulieren: Schleifenversion: Die Summe wird für die Schleifen- und Arraylänge berechnet. Zeigerversion: Verwenden Sie Zeiger, um auf Array-Elemente zu verweisen, und eine effiziente Summierung wird durch Selbststillstandszeiger erzielt. Dynamisch Array -Array -Version zuweisen: Zuordnen Sie Arrays dynamisch und verwalten Sie selbst den Speicher selbst, um sicherzustellen, dass der zugewiesene Speicher befreit wird, um Speicherlecks zu verhindern.
 Wer bekommt mehr Python oder JavaScript bezahlt?
Apr 04, 2025 am 12:09 AM
Es gibt kein absolutes Gehalt für Python- und JavaScript -Entwickler, je nach Fähigkeiten und Branchenbedürfnissen. 1. Python kann mehr in Datenwissenschaft und maschinellem Lernen bezahlt werden. 2. JavaScript hat eine große Nachfrage in der Entwicklung von Front-End- und Full-Stack-Entwicklung, und sein Gehalt ist auch beträchtlich. 3. Einflussfaktoren umfassen Erfahrung, geografische Standort, Unternehmensgröße und spezifische Fähigkeiten.
 Bedarf die Produktion von H5 -Seiten eine kontinuierliche Wartung?
Apr 05, 2025 pm 11:27 PM
Die H5 -Seite muss aufgrund von Faktoren wie Code -Schwachstellen, Browserkompatibilität, Leistungsoptimierung, Sicherheitsaktualisierungen und Verbesserungen der Benutzererfahrung kontinuierlich aufrechterhalten werden. Zu den effektiven Wartungsmethoden gehören das Erstellen eines vollständigen Testsystems, die Verwendung von Versionstools für Versionskontrolle, die regelmäßige Überwachung der Seitenleistung, das Sammeln von Benutzern und die Formulierung von Wartungsplänen.
 Ist DifferiDItistinginginging verwandt?
Apr 03, 2025 pm 10:30 PM
Obwohl eindeutig und unterschiedlich mit der Unterscheidung zusammenhängen, werden sie unterschiedlich verwendet: Unterschieds (Adjektiv) beschreibt die Einzigartigkeit der Dinge selbst und wird verwendet, um Unterschiede zwischen den Dingen zu betonen; Das Unterscheidungsverhalten oder die Fähigkeit des Unterschieds ist eindeutig (Verb) und wird verwendet, um den Diskriminierungsprozess zu beschreiben. In der Programmierung wird häufig unterschiedlich, um die Einzigartigkeit von Elementen in einer Sammlung darzustellen, wie z. B. Deduplizierungsoperationen; Unterscheidet spiegelt sich in der Gestaltung von Algorithmen oder Funktionen wider, wie z. B. die Unterscheidung von ungeraden und sogar Zahlen. Bei der Optimierung sollte der eindeutige Betrieb den entsprechenden Algorithmus und die Datenstruktur auswählen, während der unterschiedliche Betrieb die Unterscheidung zwischen logischer Effizienz optimieren und auf das Schreiben klarer und lesbarer Code achten sollte.
 Wie versteht man! X in c?
Apr 03, 2025 pm 02:33 PM
! X Understanding! X ist ein logischer Nicht-Operator in der C-Sprache. Es booleschen den Wert von x, dh wahre Änderungen zu falschen, falschen Änderungen an True. Aber seien Sie sich bewusst, dass Wahrheit und Falschheit in C eher durch numerische Werte als durch Boolesche Typen dargestellt werden, ungleich Null wird als wahr angesehen und nur 0 wird als falsch angesehen. Daher handelt es sich um negative Zahlen wie positive Zahlen und gilt als wahr.
 Was bedeutet Summe in der C -Sprache?
Apr 03, 2025 pm 02:36 PM
Es gibt keine integrierte Summenfunktion in C für die Summe, kann jedoch implementiert werden durch: Verwenden einer Schleife, um Elemente nacheinander zu akkumulieren; Verwenden eines Zeigers, um auf die Elemente nacheinander zuzugreifen und zu akkumulieren; Betrachten Sie für große Datenvolumina parallele Berechnungen.
 Wie erhalten Sie Echtzeit-Anwendungs- und Zuschauerdaten auf der Arbeit von 58.com?
Apr 05, 2025 am 08:06 AM
Wie erhalte ich dynamische Daten von 58.com Arbeitsseite beim Kriechen? Wenn Sie eine Arbeitsseite von 58.com mit Crawler -Tools kriechen, können Sie auf diese begegnen ...
 Was ist der Grund, warum PS immer wieder Laden zeigt?
Apr 06, 2025 pm 06:39 PM
PS "Laden" Probleme werden durch Probleme mit Ressourcenzugriff oder Verarbeitungsproblemen verursacht: Die Lesegeschwindigkeit von Festplatten ist langsam oder schlecht: Verwenden Sie Crystaldiskinfo, um die Gesundheit der Festplatte zu überprüfen und die problematische Festplatte zu ersetzen. Unzureichender Speicher: Upgrade-Speicher, um die Anforderungen von PS nach hochauflösenden Bildern und komplexen Schichtverarbeitung zu erfüllen. Grafikkartentreiber sind veraltet oder beschädigt: Aktualisieren Sie die Treiber, um die Kommunikation zwischen PS und der Grafikkarte zu optimieren. Dateipfade sind zu lang oder Dateinamen haben Sonderzeichen: Verwenden Sie kurze Pfade und vermeiden Sie Sonderzeichen. Das eigene Problem von PS: Installieren oder reparieren Sie das PS -Installateur neu.


