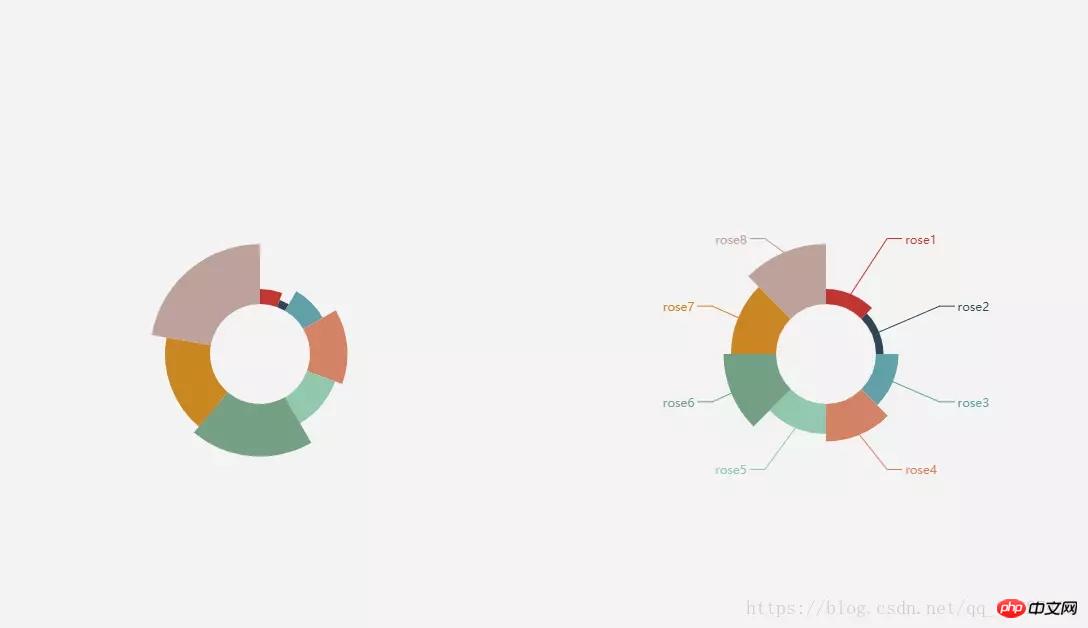
This article mainly introduces the relevant information of html5 canvas to simply encapsulate a pie chart that cannot be implemented by echarts. The editor thinks it is quite good, so I will share it with you now and give it as a reference. Let’s follow the editor and take a look.
Explanation
I have been using echars for a long time. If a pie chart with the style shown above appears, It is difficult for me to implement it using echarts. The official documents do not have a pie chart in this mode. I tried using d3 and canvas to draw pie charts respectively. Because I am familiar with canvas and d3 also needs to introduce plug-ins, based on the principle of lightweight, I used canvas packaging.
Two official pie chart modes: (1) Radius mode (2) Area mode

Implementation process
(1) The encapsulated function is as follows:
function drawCircle(canvasId, option) {
    const color_arr = option.color
    let data_arr = option.data
    const pi2 = Math.PI * 2;
    let canvas = document.getElementById(canvasId);
    let c = canvas.getContext("2d");
    let startAgl = 0;
    let agl;
    let sum = 0;
    const cW = canvas.width;
    const cH = canvas.height;
    for (let item of data_arr) {
      sum += item.value * 1.0
    }
    data_arr = data_arr.map((v, i) => {
      return {
        name: v.name,
        value: (v.value) * 1.0 / sum
      }
    })
    for (let i = 0; i < data_arr.length; i++) {
      //绘制饼图
      let min = (cW > cH ? cH : cW); //获取canvas宽高的最小值
      agl = data_arr[i].value * pi2 + startAgl; //终点
      c.strokeStyle = color_arr[i];
      c.lineWidth = data_arr[i].value * min * 0.3; // 线的粗细
      c.beginPath();
      c.arc(cW / 2, cH / 2, min * 0.3, startAgl, agl, false); //画圆
      c.stroke();
      c.closePath();
      startAgl = agl;

      //绘制图例
      c.fillStyle = color_arr[i];
      c.fillRect(cW * 0.8, 50 + 18 * i, 16, 16);
      c.fillText(data_arr[i].name, cW * 0.8 + 20, 62 + 18 * i);
    }
}(2) Calling method:
let color = ['#0580F2', '#FAA732', '#E1575D', '#8B73CC', '#8CD123', '#4B53BA', '#429588'];
  let option = {
    color: color,
    data: [
      { name: '20', value: '20' },
      { name: '30', value: '30' },
      { name: '40', value: '40' },
      { name: '50', value: '50' },
      { name: '60', value: '60' },
    ]
  }
drawCircle('myCanvas', option)The above is the entire content of this article. I hope it will be helpful to everyone's study. For more related content, please pay attention to the PHP Chinese website!
Related recommendations:
implementation of dynamic bubble buttons in html5 and css3
HTML5 Canvas implementation method for drawing curves
The above is the detailed content of Use html5 canvas to encapsulate a pie chart that echarts cannot implement. For more information, please follow other related articles on the PHP Chinese website!


