

统计主表关联的满足一定条件的子表数量

统计主表关联的满足一定条件的子表数量 统计主表关联的子表数量: 其中znld是主表的id; 主表:specialcase 子表:to_zhuanan_xsczqk,to_zhuanan_xckcqz www.2cto.com String cxfSql = select ((select count(*) from to_zhuanan_xsczqk a,specialcase b wh
统计主表关联的满足一定条件的子表数量
统计主表关联的子表数量:
其中znld是主表的id;
主表:specialcase
子表:to_zhuanan_xsczqk,to_zhuanan_xckcqz
www.2cto.com
String cxfSql = "select ((select count(*) from to_zhuanan_xsczqk a,specialcase b where a.zhuanan_id=b.id and a.xsczqksj>=to_date('"+ time1+ "','yyyy-MM-dd') and a.xsczqksj
+ znId
+ "')+(select count(*) from to_zhuanan_xckcqz a,specialcase b where a.zhuanan_id=b.id and a.XCKCQZSJ>=to_date('"+ time1+ "','yyyy-MM-dd') and a.XCKCQZSJ
+ znId
+ "')) as shuliang from dual";

Hot AI Tools

Undresser.AI Undress
AI-powered app for creating realistic nude photos

AI Clothes Remover
Online AI tool for removing clothes from photos.

Undress AI Tool
Undress images for free

Clothoff.io
AI clothes remover

Video Face Swap
Swap faces in any video effortlessly with our completely free AI face swap tool!

Hot Article
Hot Tools

Notepad++7.3.1
Easy-to-use and free code editor

SublimeText3 Chinese version
Chinese version, very easy to use

Zend Studio 13.0.1
Powerful PHP integrated development environment

Dreamweaver CS6
Visual web development tools

SublimeText3 Mac version
God-level code editing software (SublimeText3)
Hot Topics
 1387
1387
 52
52

 How to implement data statistics and analysis in uniapp
Oct 24, 2023 pm 12:37 PM
How to implement data statistics and analysis in uniapp
Oct 24, 2023 pm 12:37 PM
How to implement data statistics and analysis in uniapp 1. Background introduction Data statistics and analysis are a very important part of the mobile application development process. Through statistics and analysis of user behavior, developers can have an in-depth understanding of user preferences and usage habits. Thereby optimizing product design and user experience. This article will introduce how to implement data statistics and analysis functions in uniapp, and provide some specific code examples. 2. Choose appropriate data statistics and analysis tools. The first step to implement data statistics and analysis in uniapp is to choose the appropriate data statistics and analysis tools.
 How to use SQL statements for data aggregation and statistics in MySQL?
Dec 17, 2023 am 08:41 AM
How to use SQL statements for data aggregation and statistics in MySQL?
Dec 17, 2023 am 08:41 AM
How to use SQL statements for data aggregation and statistics in MySQL? Data aggregation and statistics are very important steps when performing data analysis and statistics. As a powerful relational database management system, MySQL provides a wealth of aggregation and statistical functions, which can easily perform data aggregation and statistical operations. This article will introduce the method of using SQL statements to perform data aggregation and statistics in MySQL, and provide specific code examples. 1. Use the COUNT function for counting. The COUNT function is the most commonly used
 Implementation of linear and pie chart functions in Vue statistical charts
Aug 19, 2023 pm 06:13 PM
Implementation of linear and pie chart functions in Vue statistical charts
Aug 19, 2023 pm 06:13 PM
The linear and pie chart functions of Vue statistical charts are implemented in the field of data analysis and visualization. Statistical charts are a very commonly used tool. As a popular JavaScript framework, Vue provides convenient methods to implement various functions, including the display and interaction of statistical charts. This article will introduce how to use Vue to implement linear and pie chart functions, and provide corresponding code examples. Linear graph function implementation A linear graph is a type of chart used to display trends and changes in data. In Vue, we can use some excellent
 Use Google Analytics to count website data in Beego
Jun 22, 2023 am 09:19 AM
Use Google Analytics to count website data in Beego
Jun 22, 2023 am 09:19 AM
With the rapid development of the Internet, the use of Web applications is becoming more and more common. How to monitor and analyze the usage of Web applications has become a focus of developers and website operators. Google Analytics is a powerful website analytics tool that can track and analyze the behavior of website visitors. This article will introduce how to use Google Analytics in Beego to collect website data. 1. To register a Google Analytics account, you first need to
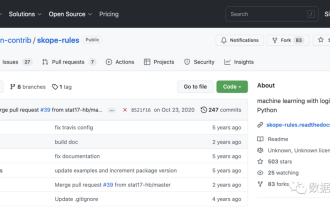 Increase your knowledge! Machine learning with logical rules
Apr 01, 2023 pm 10:07 PM
Increase your knowledge! Machine learning with logical rules
Apr 01, 2023 pm 10:07 PM
On the precision-recall curve, the same points are plotted with different axes. Warning: The first red dot on the left (0% recall, 100% precision) corresponds to 0 rules. The second dot on the left is the first rule, and so on. Skope-rules uses a tree model to generate rule candidates. First build some decision trees and consider the paths from the root node to internal nodes or leaf nodes as rule candidates. These candidate rules are then filtered by some predefined criteria such as precision and recall. Only those with precision and recall above their thresholds are retained. Finally, similarity filtering is applied to select rules with sufficient diversity. In general, Skope-rules are applied to learn the root cause of each
 Steps of statistical analysis
Jun 28, 2023 pm 03:27 PM
Steps of statistical analysis
Jun 28, 2023 pm 03:27 PM
Statistical analysis often refers to the process of sorting, classifying and interpreting collected relevant data. The basic steps of statistical analysis include: 1. Collect data; 2. Organize data; 3. Analyze data.
 How to quickly build a statistical chart system under the Vue framework
Aug 21, 2023 pm 05:48 PM
How to quickly build a statistical chart system under the Vue framework
Aug 21, 2023 pm 05:48 PM
How to quickly build a statistical chart system under the Vue framework. In modern web applications, statistical charts are an essential component. As a popular front-end framework, Vue.js provides many convenient tools and components that can help us quickly build a statistical chart system. This article will introduce how to use the Vue framework and some plug-ins to build a simple statistical chart system. First, we need to prepare a Vue.js development environment, including installing Vue scaffolding and some related plug-ins. Execute the following command in the command line
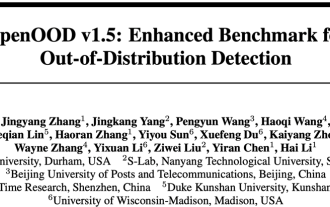 OpenOOD update v1.5: Comprehensive and accurate out-of-distribution detection code library and testing platform, supporting online rankings and one-click testing
Jul 03, 2023 pm 04:41 PM
OpenOOD update v1.5: Comprehensive and accurate out-of-distribution detection code library and testing platform, supporting online rankings and one-click testing
Jul 03, 2023 pm 04:41 PM
Out-of-distribution (OOD) detection is crucial for the reliable operation of open-world intelligent systems, but current object-oriented detection methods suffer from "evaluation inconsistencies" (evaluation inconsistencies). Previous work OpenOODv1 unifies the evaluation of OOD detection, but still has limitations in scalability and usability. Recently, the development team once again proposed OpenOODv1.5. Compared with the previous version, the new OOD detection method evaluation has been significantly improved in ensuring accuracy, standardization and user-friendliness. Image Paper: https://arxiv.org/abs/2306.09301OpenOODCodebase:htt
