

因为dwarf2

原有的代码做了部分修改,再调试的时,p某个变量出现"dwarf2_read_address: Corrupted DWARF expression"错误,在网上搜了一下,是由于gdb的bug导致的,该bug已在GDB 6.7及以上版本修复。测试服务器上的版本刚好是6.5,不得不升级一下gdb了,这年头连GDB都靠
原有的代码做了部分修改,再调试的时,p某个变量出现"dwarf2_read_address: Corrupted DWARF expression"错误,在网上搜了一下,是由于gdb的bug导致的,该bug已在GDB 6.7及以上版本修复。测试服务器上的版本刚好是6.5,不得不升级一下gdb了,这年头连GDB都靠不住啊。
在http://www.gnu.org/software/gdb/上找到最新的7.2版本,下载,解压缩,一路./configure->make->make install后,用gdb -v看了一下版本,竟然还是6.5。查了下GDB的默认安装目录是/usr/loca/bin,export命令查看了下我机器默认的环境变量是/usr/bin,于是备份旧版本的gdb程序后,将usr/loca/bin下新的gdb可执行程序复制过去。gdb -v终于显示版本7.2。调试一下程序,原来的bug不见了。
done

Hot AI Tools

Undresser.AI Undress
AI-powered app for creating realistic nude photos

AI Clothes Remover
Online AI tool for removing clothes from photos.

Undress AI Tool
Undress images for free

Clothoff.io
AI clothes remover

Video Face Swap
Swap faces in any video effortlessly with our completely free AI face swap tool!

Hot Article
Hot Tools

Notepad++7.3.1
Easy-to-use and free code editor

SublimeText3 Chinese version
Chinese version, very easy to use

Zend Studio 13.0.1
Powerful PHP integrated development environment

Dreamweaver CS6
Visual web development tools

SublimeText3 Mac version
God-level code editing software (SublimeText3)
Hot Topics


 Detailed explanation of C++ function debugging: How to debug problems in multi-threaded functions?
May 02, 2024 pm 04:15 PM
Detailed explanation of C++ function debugging: How to debug problems in multi-threaded functions?
May 02, 2024 pm 04:15 PM
C++ multi-thread debugging can use GDB: 1. Enable debugging information compilation; 2. Set breakpoints; 3. Use infothreads to view threads; 4. Use thread to switch threads; 5. Use next, stepi, and locals to debug. Actual case debugging deadlock: 1. Use threadapplyallbt to print the stack; 2. Check the thread status; 3. Single-step the main thread; 4. Use condition variables to coordinate access to solve the deadlock.
 How to use LeakSanitizer to debug C++ memory leaks?
Jun 02, 2024 pm 09:46 PM
How to use LeakSanitizer to debug C++ memory leaks?
Jun 02, 2024 pm 09:46 PM
How to use LeakSanitizer to debug C++ memory leaks? Install LeakSanitizer. Enable LeakSanitizer via compile flag. Run the application and analyze the LeakSanitizer report. Identify memory allocation types and allocation locations. Fix memory leaks and ensure all dynamically allocated memory is released.
 Shortcut to golang function debugging and analysis
May 06, 2024 pm 10:42 PM
Shortcut to golang function debugging and analysis
May 06, 2024 pm 10:42 PM
This article introduces shortcuts for Go function debugging and analysis, including: built-in debugger dlv, which is used to pause execution, check variables, and set breakpoints. Logging, use the log package to record messages and view them during debugging. The performance analysis tool pprof generates call graphs and analyzes performance, and uses gotoolpprof to analyze data. Practical case: Analyze memory leaks through pprof and generate a call graph to display the functions that cause leaks.
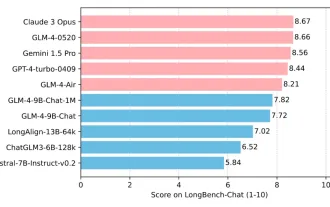 Tsinghua University and Zhipu AI open source GLM-4: launching a new revolution in natural language processing
Jun 12, 2024 pm 08:38 PM
Tsinghua University and Zhipu AI open source GLM-4: launching a new revolution in natural language processing
Jun 12, 2024 pm 08:38 PM
Since the launch of ChatGLM-6B on March 14, 2023, the GLM series models have received widespread attention and recognition. Especially after ChatGLM3-6B was open sourced, developers are full of expectations for the fourth-generation model launched by Zhipu AI. This expectation has finally been fully satisfied with the release of GLM-4-9B. The birth of GLM-4-9B In order to give small models (10B and below) more powerful capabilities, the GLM technical team launched this new fourth-generation GLM series open source model: GLM-4-9B after nearly half a year of exploration. This model greatly compresses the model size while ensuring accuracy, and has faster inference speed and higher efficiency. The GLM technical team’s exploration has not
 How to debug PHP asynchronous code
May 31, 2024 am 09:08 AM
How to debug PHP asynchronous code
May 31, 2024 am 09:08 AM
Tools for debugging PHP asynchronous code include: Psalm: a static analysis tool that can find potential errors. ParallelLint: A tool that inspects asynchronous code and provides recommendations. Xdebug: An extension for debugging PHP applications by enabling a session and stepping through the code. Other tips include using logging, assertions, running code locally, and writing unit tests.
 How to conduct concurrency testing and debugging in Java concurrent programming?
May 09, 2024 am 09:33 AM
How to conduct concurrency testing and debugging in Java concurrent programming?
May 09, 2024 am 09:33 AM
Concurrency testing and debugging Concurrency testing and debugging in Java concurrent programming are crucial and the following techniques are available: Concurrency testing: Unit testing: Isolate and test a single concurrent task. Integration testing: testing the interaction between multiple concurrent tasks. Load testing: Evaluate an application's performance and scalability under heavy load. Concurrency Debugging: Breakpoints: Pause thread execution and inspect variables or execute code. Logging: Record thread events and status. Stack trace: Identify the source of the exception. Visualization tools: Monitor thread activity and resource usage.
 The Mistral open source code model takes the throne! Codestral is crazy about training in over 80 languages, and domestic Tongyi developers are asking to participate!
Jun 08, 2024 pm 09:55 PM
The Mistral open source code model takes the throne! Codestral is crazy about training in over 80 languages, and domestic Tongyi developers are asking to participate!
Jun 08, 2024 pm 09:55 PM
Produced by 51CTO technology stack (WeChat ID: blog51cto) Mistral released its first code model Codestral-22B! What’s crazy about this model is not only that it’s trained on over 80 programming languages, including Swift, etc. that many code models ignore. Their speeds are not exactly the same. It is required to write a "publish/subscribe" system using Go language. The GPT-4o here is being output, and Codestral is handing in the paper so fast that it’s hard to see! Since the model has just been launched, it has not yet been publicly tested. But according to the person in charge of Mistral, Codestral is currently the best-performing open source code model. Friends who are interested in the picture can move to: - Hug the face: https
 What are the debugging techniques for recursive calls in Java functions?
May 05, 2024 am 10:48 AM
What are the debugging techniques for recursive calls in Java functions?
May 05, 2024 am 10:48 AM
The following techniques are available for debugging recursive functions: Check the stack traceSet debug pointsCheck if the base case is implemented correctlyCount the number of recursive callsVisualize the recursive stack
