探究内存泄露—Part2—分析问题
本文由ImportNew-黄索远翻译自captaindebug ImportNew注:如果你也对Java技术翻译分享感兴趣,欢迎加入我们的Java开发小组。参与方式请查看小组简介。 如果你看过这篇博客的第一部分,就会知道在展示的内存泄露示例代码使用生产者-消费者模型创建了一个模拟
本文由 ImportNew - 黄索远 翻译自 captaindebug
ImportNew注:如果你也对Java技术翻译分享感兴趣,欢迎加入我们的 Java开发 小组。参与方式请查看小组简介。
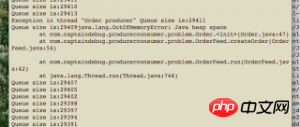
如果你看过这篇博客的第一部分,就会知道在展示的内存泄露示例代码使用生产者-消费者模型创建了一个模拟股票交易的应用,所有的交易命令都被存入一个虚拟的数据库中。示例代码故意留下了一个缺陷(OrderRecord线程处理一条命令后sleep一段时间),使得OrderRecord线程消费命令的速度跟不上OrderFeed线程生产命令的速度。这就意味着存储命令的队列会变得越来越长,直到最后内存溢出程序崩溃。问题是,如果只看我的代码,确实能够很轻松得看出哪里出了差错;但是如果出问题的代码你从未看过并且代码又长又复杂,加之没有监控线程来帮助你观察队列大小或者其他内部信息,这时该怎么办呢?
下面向大家介绍分析程序内存泄露问题的三个步骤:
提取发生内存泄露的服务器的转储文件。
用这个转储文件生成报告。
分析生成的报告。
有几个工具能帮你生成堆转储文件,分别是:
jconsole
Jvisualvm
Eclipse Memory Analyser Tool(MAT)
用jconsole提取堆转储文件
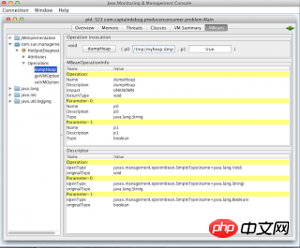
将jconsole关联你的应用:单击MBeans选项卡打开com.sun.management包,点击HotSpotDiagnostic,点击Operations选择dumpHeap。这时你将会看到dumpHeap操作:它接受两个参数p0和p1。在p0的编辑框内输入一个堆转储的文件名,然后按下DumpHeap命令。
用jvisualvm提取堆转储文件
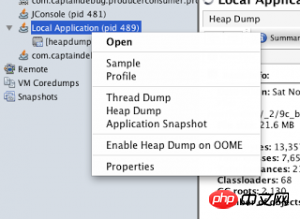
连接示例代码,右键点击你的应用,在左侧的“application”窗格中选择“Heap Dump”。
注意:如果你在发生内存泄露的服务器上有一个远程连接,那么jvisualvm将会把转出文件保存在远程机器(假设这是一台unix机器)上的/tmp目录下。你不得不将这个文件通过FTP传送到你的机器上,然后再进行研究。
用MAT来提取堆转储文件
jconsole和jvisualvm本身就是JDK的一部分,而MAT或者称作“内存分析工具”,是一个基于eclipse的工具。你可以从eclipse.org下载。
最新版本的MAT需要你在电脑上安装JDk1.6。如果你用的是Java1.7版本也不用担心,因为它会自动为你安装1.6版本,并且不会和安装好了的1.7版本产生冲突。

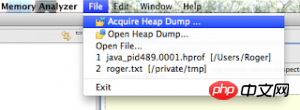
使用MAT的时候,只需要点击“Aquire Heap Dump”,然后遵循指示就可以了。
远程连接
-Dcom.sun.management.jmxremote
-Dcom.sun.management.jmxremote.port=9010
-Dcom.sun.management.jmxremote.local.only=false
-Dcom.sun.management.jmxremote.authenticate=false
-Dcom.sun.management.jmxremote.ssl=false
何时提取堆转存文件
这需要耗费一点心力和运气。如果太早提取了堆转储文件,那么你将不能发现问题。因为它们被合法,非泄露类的实例屏蔽了。不过也不能等待太久,因为提取堆转储文件需要占用内存,进行提取操作的时候可能会导致你的应用崩溃。
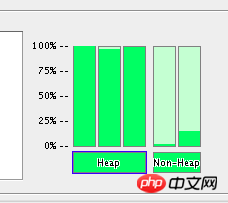
最好的办法是将jconsole连接到你的应用程序并监控堆的占用情况,知道它看起来像在崩溃的边缘。这样很容易就能监控到,因为没有发生内存泄露时,三个堆部分指标都是绿色的。
分析转储文件
现在轮到MAT发挥作用了,因为它本身就是被设计用来分析堆转储文件的。要打开和分析一个堆转储文件,选择File选项下的Heap Dump选项。选择了你要打开的文件后,你将会看到如下三个选项:
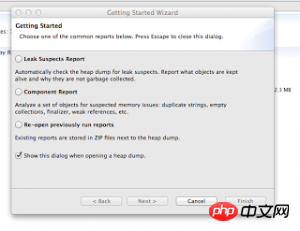
选择Leak Suspect Report选项。在MAT翻腾几秒后,会生成这样的一个页面:

如饼状图显示:在示例中,疑似有一处发生了内存泄露。也许你会想,这样的做法只有在代码受到控制的情况下才可取。毕竟这只是个例子,这又能说明什么呢?好吧,我承认在这个例子里,所有的问题都是可见的;线程a占用了98.7MB内存,其他线程用了1.5MB。在实际情况中,你得到的图表是这样的。
下一步要做的就是挖得更深一点……
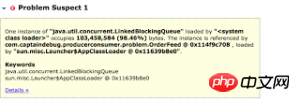
如上图所示,报告的下一部分告诉我们,有一个LinkedBlockQueue占用了98.46%的内存。想要进一步的探究,点击Details>>。

可以看到,问题确实是出在我们的orderQueue上。这个队列里存储了所有生成的虚拟命令,并且可以被我们上篇博文里提到的三个线程OrderFeed、OrderRecord、OrderMonitor访问。
那么一切都清楚了,MAT告诉我们:示例代码中有一个LinkedBlockQueue,这个队列用尽了所有的内存,从而导致了严重的问题。不过我们不知道这个问题为什么会产生,也不能指望MAT告诉我们。这个问题,如阿加莎·克里斯蒂笔下的赫尔克里·波洛所说,得用“泽灰色小细胞”解决……
以上就是探究内存泄露—Part2—分析问题的内容,更多相关内容请关注PHP中文网(www.php.cn)!

Hot AI Tools

Undresser.AI Undress
AI-powered app for creating realistic nude photos

AI Clothes Remover
Online AI tool for removing clothes from photos.

Undress AI Tool
Undress images for free

Clothoff.io
AI clothes remover

AI Hentai Generator
Generate AI Hentai for free.

Hot Article

Hot Tools

Notepad++7.3.1
Easy-to-use and free code editor

SublimeText3 Chinese version
Chinese version, very easy to use

Zend Studio 13.0.1
Powerful PHP integrated development environment

Dreamweaver CS6
Visual web development tools

SublimeText3 Mac version
God-level code editing software (SublimeText3)

Hot Topics
 How to solve win11 memory leak. Analysis of the causes of win11 memory leak and various solutions.
Feb 29, 2024 am 09:58 AM
Recently, many friends who use win11 system have found that the memory occupied by their computer desktop window is very large, and there are also serious memory leaks, which will cause other programs to run unsmoothly. To address this problem, we should How can users solve it? We open the control panel of the computer, click to select the function of the power button, and uncheck the enable fast startup option. Restarting the computer will solve the problem. There may also be a problem with the graphics card driver. Just re-download the driver. . Causes of memory leaks: Memory leaks are caused by misaligned resources in a computer program due to incorrect memory allocation. This happens when unused RAM locations are still not freed. Do not confuse memory leaks with space leaks or memory leaks
 Golang function memory leak detection and resolution
Apr 23, 2024 pm 05:09 PM
There is a function memory leak in the Go language, which will cause the application to continuously consume memory and crash. We can use the runtime/pprof package for detection and check if a function accidentally holds a reference to an unneeded resource. To solve a memory leak, we need to find the reference that caused the leak, usually by inspecting the function code and looking for global variables or closure references.
 Detailed analysis of common memory management issues in C++
Oct 10, 2023 am 10:51 AM
C++ is a powerful programming language, but it is also a language that requires careful handling of memory management. When writing programs in C++, memory management problems are often encountered. This article will analyze common memory management issues in C++ in detail and provide specific code examples to help readers understand and solve these problems. 1. Memory leak (MemoryLeak) Memory leak means that the dynamically allocated memory in the program is not released correctly, resulting in a waste of memory resources. This is a common problem, especially on large or long runs
 Memory leaks in PHP applications: causes, detection and resolution
May 09, 2024 pm 03:57 PM
A PHP memory leak occurs when an application allocates memory and fails to release it, resulting in a reduction in the server's available memory and performance degradation. Causes include circular references, global variables, static variables, and expansion. Detection methods include Xdebug, Valgrind and PHPUnitMockObjects. The resolution steps are: identify the source of the leak, fix the leak, test and monitor. Practical examples illustrate memory leaks caused by circular references, and specific methods to solve the problem by breaking circular references through destructors.
 How to solve the problem of excessive memory and leakage in Linux system
Jun 30, 2023 pm 02:21 PM
How to deal with the frequent problems of high memory usage and memory leaks in Linux systems. In the process of using Linux systems, we sometimes encounter problems of high memory usage and memory leaks. These issues can cause system slowdowns, application crashes, and even system crashes. This article explores how to resolve these issues. First, let’s understand the concepts of high memory usage and memory leaks. High Memory Usage High memory usage means that there is very little memory available in the system and most of the memory is in use. When memory is used
 How to solve common problems of memory release in Java functions?
May 02, 2024 am 09:57 AM
Memory management in Java involves garbage collection, but problems can still arise. Common problems include memory leaks and memory fragmentation. Memory leaks are caused by objects holding references that are no longer needed and can be solved by avoiding reference cycles, using weak references, and limiting variable scope. Memory fragmentation is caused by frequent allocation and deallocation and can be solved by using memory pools, large object pools, and compact garbage collection. For example, using weak references can handle memory leaks and ensure that the garbage collector reclaims objects when they are no longer needed.
 Golang development notes: How to avoid memory leak problems
Nov 23, 2023 am 09:38 AM
Golang is a fast and efficient development language that is widely popular for its powerful concurrency capabilities and built-in garbage collection mechanism. However, even when developing with Golang, it is still possible to encounter memory leaks. This article will introduce some common Golang development considerations to help developers avoid memory leak problems. Avoid circular references Circular references are one of the common memory leak problems in Golang. When two objects refer to each other, if the references to these objects are not released in a timely manner,
 Talk about potential risks in Go language development
Mar 04, 2024 pm 03:33 PM
As a fast, efficient and easy-to-use programming language, Go language is increasingly favored by developers. However, just like any programming language, there are also some potential risks in Go language development. If not paid attention to and handled, it may lead to a decrease in code quality and even serious consequences. This article will explore some potential risks in Go language development, and analyze and discuss them with specific code examples. 1. Traps of concurrent processing Go language inherently supports concurrent programming through goroutine and chann


