

OJ 调试技巧:VS2010 中 通过设置编译参数定义宏,无需修改源文

一般OJ都是使用 标准输入输出,这样在本地调试时很不方便,可以通过下面的方法 重定向标准输入输出到文件: #ifdef LOCAL_DEBUG freopen( in.txt , r , stdin); # endif 这样做有一个问题就是 如果在代码中定义宏LOCAL_DEBUG,则在提交时必须取消其定义,这
一般OJ都是使用 标准输入输出,这样在本地调试时很不方便,可以通过下面的方法 重定向标准输入输出到文件:
1 2 3 |
|
这样做有一个问题就是 如果在代码中定义宏LOCAL_DEBUG,则在提交时必须取消其定义,这样改来改去很麻烦,有没有更方便的方法呢?请看下文。
上面的代码说明只要定义了 宏 LOCAL_DEBUG,就将标准输入重定向到文件 in.txt。在VS2010中,宏 LOCAL_DEBUG 可以通过设置编译参数来定义,这样在本地调试时使用文件输入,而且 无需修改源文件即可直接提交 ,在OJ 服务器中由于没有定义 宏 LOCAL_DEBUG,所以标准输入并没有被重定向,perfect!
方法如下:
如项目名 为 test 。
项目-> test 属性(最下面)-> 配置属性 -> C/C++ -> 命令行 。在下面的 “其他选项” 中 输入 “ /D LOCAL_DEBUG ”,再点 右下角 “ 应用 ”。OK !

给个程序测试一下,in.txt 文件放在 test 项目根目录下。
1 2 3 4 5 6 7 8 9 10 11 12 13 14 15 16 |
|

Hot AI Tools

Undresser.AI Undress
AI-powered app for creating realistic nude photos

AI Clothes Remover
Online AI tool for removing clothes from photos.

Undress AI Tool
Undress images for free

Clothoff.io
AI clothes remover

AI Hentai Generator
Generate AI Hentai for free.
Hot Article
Hot Tools

Notepad++7.3.1
Easy-to-use and free code editor

SublimeText3 Chinese version
Chinese version, very easy to use

Zend Studio 13.0.1
Powerful PHP integrated development environment

Dreamweaver CS6
Visual web development tools

SublimeText3 Mac version
God-level code editing software (SublimeText3)
Hot Topics
 1377
1377
 52
52

 Detailed explanation of C++ function debugging: How to debug problems in multi-threaded functions?
May 02, 2024 pm 04:15 PM
Detailed explanation of C++ function debugging: How to debug problems in multi-threaded functions?
May 02, 2024 pm 04:15 PM
C++ multi-thread debugging can use GDB: 1. Enable debugging information compilation; 2. Set breakpoints; 3. Use infothreads to view threads; 4. Use thread to switch threads; 5. Use next, stepi, and locals to debug. Actual case debugging deadlock: 1. Use threadapplyallbt to print the stack; 2. Check the thread status; 3. Single-step the main thread; 4. Use condition variables to coordinate access to solve the deadlock.
 Do Not Disturb Mode Not Working in iPhone: Fix
Apr 24, 2024 pm 04:50 PM
Do Not Disturb Mode Not Working in iPhone: Fix
Apr 24, 2024 pm 04:50 PM
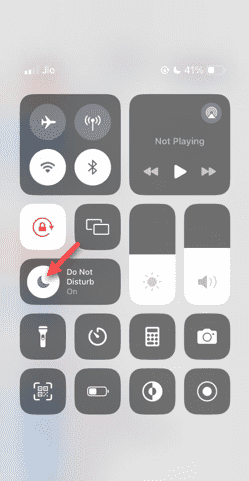
Even answering calls in Do Not Disturb mode can be a very annoying experience. As the name suggests, Do Not Disturb mode turns off all incoming call notifications and alerts from emails, messages, etc. You can follow these solution sets to fix it. Fix 1 – Enable Focus Mode Enable focus mode on your phone. Step 1 – Swipe down from the top to access Control Center. Step 2 – Next, enable “Focus Mode” on your phone. Focus Mode enables Do Not Disturb mode on your phone. It won't cause any incoming call alerts to appear on your phone. Fix 2 – Change Focus Mode Settings If there are some issues in the focus mode settings, you should fix them. Step 1 – Open your iPhone settings window. Step 2 – Next, turn on the Focus mode settings
 How to use LeakSanitizer to debug C++ memory leaks?
Jun 02, 2024 pm 09:46 PM
How to use LeakSanitizer to debug C++ memory leaks?
Jun 02, 2024 pm 09:46 PM
How to use LeakSanitizer to debug C++ memory leaks? Install LeakSanitizer. Enable LeakSanitizer via compile flag. Run the application and analyze the LeakSanitizer report. Identify memory allocation types and allocation locations. Fix memory leaks and ensure all dynamically allocated memory is released.
 Shortcut to golang function debugging and analysis
May 06, 2024 pm 10:42 PM
Shortcut to golang function debugging and analysis
May 06, 2024 pm 10:42 PM
This article introduces shortcuts for Go function debugging and analysis, including: built-in debugger dlv, which is used to pause execution, check variables, and set breakpoints. Logging, use the log package to record messages and view them during debugging. The performance analysis tool pprof generates call graphs and analyzes performance, and uses gotoolpprof to analyze data. Practical case: Analyze memory leaks through pprof and generate a call graph to display the functions that cause leaks.
 How to conduct concurrency testing and debugging in Java concurrent programming?
May 09, 2024 am 09:33 AM
How to conduct concurrency testing and debugging in Java concurrent programming?
May 09, 2024 am 09:33 AM
Concurrency testing and debugging Concurrency testing and debugging in Java concurrent programming are crucial and the following techniques are available: Concurrency testing: Unit testing: Isolate and test a single concurrent task. Integration testing: testing the interaction between multiple concurrent tasks. Load testing: Evaluate an application's performance and scalability under heavy load. Concurrency Debugging: Breakpoints: Pause thread execution and inspect variables or execute code. Logging: Record thread events and status. Stack trace: Identify the source of the exception. Visualization tools: Monitor thread activity and resource usage.
 How to debug PHP asynchronous code
May 31, 2024 am 09:08 AM
How to debug PHP asynchronous code
May 31, 2024 am 09:08 AM
Tools for debugging PHP asynchronous code include: Psalm: a static analysis tool that can find potential errors. ParallelLint: A tool that inspects asynchronous code and provides recommendations. Xdebug: An extension for debugging PHP applications by enabling a session and stepping through the code. Other tips include using logging, assertions, running code locally, and writing unit tests.
 PHP Debugging Errors: A Guide to Common Mistakes
Jun 05, 2024 pm 03:18 PM
PHP Debugging Errors: A Guide to Common Mistakes
Jun 05, 2024 pm 03:18 PM
Common PHP debugging errors include: Syntax errors: Check the code syntax to make sure there are no errors. Undefined variable: Before using a variable, make sure it is initialized and assigned a value. Missing semicolons: Add semicolons to all code blocks. Function is undefined: Check that the function name is spelled correctly and make sure the correct file or PHP extension is loaded.
 What are the debugging techniques for recursive calls in Java functions?
May 05, 2024 am 10:48 AM
What are the debugging techniques for recursive calls in Java functions?
May 05, 2024 am 10:48 AM
The following techniques are available for debugging recursive functions: Check the stack traceSet debug pointsCheck if the base case is implemented correctlyCount the number of recursive callsVisualize the recursive stack
