 Web Front-end
 HTML Tutorial
 Menu explanation of IE8 developer tools_HTML/Xhtml_Web page production
Menu explanation of IE8 developer tools_HTML/Xhtml_Web page production
This article has briefly explained each menu of the developer tools. I believe that everyone can already use this powerful tool easily.
Detailed explanation of how to use IE8 "Developer Tools" (detailed explanation of menus at all levels)
The official version of IE8 has been released. This article will not be a very nonsense evaluation, and then give something like "Chrome's ability to run JavaScript is 15 times that of IE8", "IE8 page rendering speed is 2.456 times that of Safari", and "IE8's anti-rape ability" 1.235 times higher than FireFox” is a fucking conclusion. I don't care who is better than who? All I know is: when Windows 7 is released, the market share of the IE8 browser will make it impossible for front-end developers to say: "Don't worry about IE8, not many people are using it." Therefore, this article will explain in a very pragmatic way that IE8 may be the only "developer tool" that makes developers feel friendly. At the same time, we will extend some relevant information and knowledge. So, please abandon your prejudice against IE8 and read on patiently.
Have you not installed IE8 yet?
If you are a front-end developer, then please install this thing. Because the official version has been released. Different from the previous beta version, this time we have to pay serious attention to it. Go download and install one, here is the download address——
IE8 Chinese version download list
Windows XP
Windows Vista
Windows Server 2003
Windows Server 2008
Windows XP 64-bit
Windows Vista 64-bit
Windows Server 2003 64-bit
Windows Server 2008 64- bit
IE8 English version download list
Windows XP
Windows XP 64 Bit
Windows Vista
Windows Vista 64 Bit
Windows Server 2003
Windows Server 2003 64 Bit
Windows Server 2008
Windows Server 2008 64 Bit
Oh, maybe you are worried that IE6 or IE7 in your system is finished. Well, indeed, this is possible. However, you can try the following tools. It allows you to coexist with multiple versions of IE - the solution for coexistence of multiple versions of IE - IETester
Microsoft web development and debugging tool SuperPreview (with download)
Get to know "Developer Tools"
Although this thing has changed its fashionable name, it is not a new thing. Its predecessor was "IEdevtoolbar". However, it used to be just a plug-in for IE. In IE8, the browser has automatically integrated this thing. Not only has it changed its name to a bit of a rustic, but its functions have also been enhanced a lot.
The developer tools can be called up under the tools menu of IE8, or by directly clicking the F12 shortcut key.
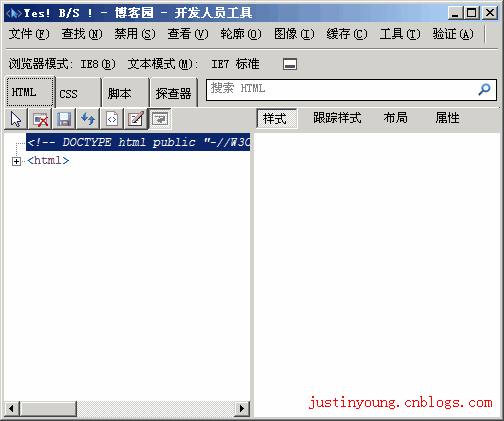 Before we introduce it, let’s first talk about what exactly this thing can do? If you just use a browser to browse the website, you don't have to worry about how the page is made. Then I think you can leave this page.
In general, developer tools are tools designed for front-end developers to develop pages. Provides a series of small tools that allow you to easily find page bugs, including html code, css code and JavaScript code. At the same time, he also provides some gadgets that are tasteless but still useful, such as color picking, screen ruler, etc.
OK, we’ve seen it and know what it can do. Then let us introduce them one by one according to the order of the menu -
This article has briefly explained each menu of the developer tools. I believe that everyone can already use this powerful tool easily.
[File] Menu
 [Undo All]
Cancel all previous operations in the developer tools, and refresh the page and DOM structure.
[Customized Internet Explorer attempt source]
[Attempt source] is such a fucking term. To put it more simply: "What editor should I use to view the source file of the web page?" For example: I use EditPlus.
【Exit】
In order not to insult your intelligence, I will not say more about this. Well, F12 is an odd-even shortcut key, let me mention this by the way.
[Find] menu
Click to select the element
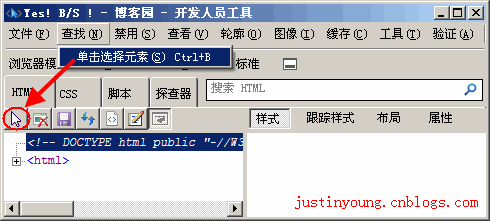 The shortcut key Ctrl B has the same effect as clicking the mouse ICO button in the picture. The most commonly used functions. Also a parity switch. When opening, when you click an element on the page with the mouse, the element will be selected, and the DOM structure, CSS style and other information of the element will be listed.
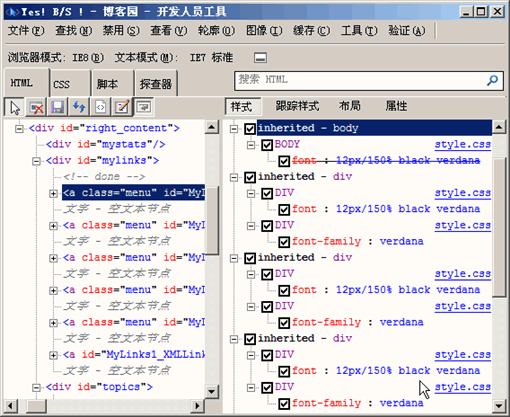 For example, the picture above. The area on the left displays the DOM information of this hyperlink element. You can clearly see its parent elements, child elements, and sibling elements.
The area on the right displays the element style information. The style that is crossed out means that the style is no longer effective because its priority is not high enough. During debugging, the previous check mark can be unchecked. When unchecked, it means forcibly deleting this style. Moreover, the properties of each style can be modified immediately with a mouse click. It is very convenient to see the modified page effect immediately.
Friends who have used FireBug in FireFox will be familiar with this. The only difference is: FireBug arranges the styles with lower priority below, that's all.
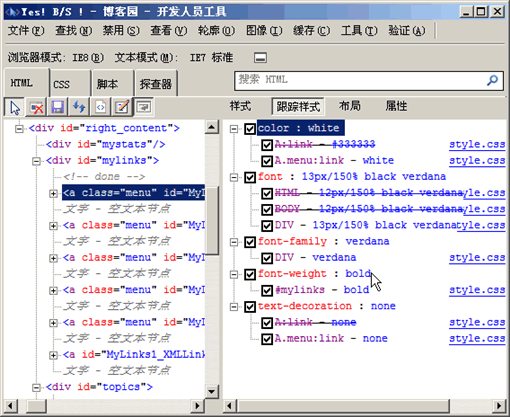 [Track Style] view and [Style] view have the same function, both are used to view the style information of the selected element. The only difference is that it changes the view mode. Which view you are used to depends on your preference.
This article has briefly explained each menu of the developer tools. I believe that everyone can already use this powerful tool easily.
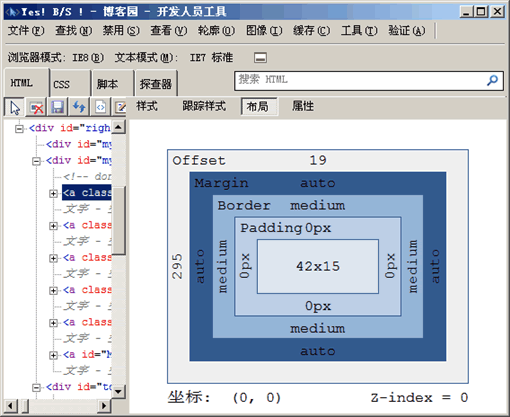 [Layout] view can display the boxed model information of the selected element. Although it can display more information than FireBug, I still prefer the way that FireBug displays it directly on the page with color blocks.
 [Attribute] view can view the attribute information of the selected element. What's very nice is that you can add or remove some properties instantly to quickly debug the page.
Oh, right. It should be noted that whether you modify the style or attributes of the selected element in the developer tools, they are only for temporary debugging and will not modify the source code of your web page.
【Disable】menu 
【Script】
will disable the use of JavaScript or VBScript scripts on the page. Why disable it? To test the robustness of the page. Some customers who have high requirements for page design will ask: "If the customer disables scripts, can this page still be used?" Well, yes, this function is used to test the abnormal needs of these fucked customers.
【Pop-up Blocker】
Filter for pop-ups. Used to test "How can I prevent the browser or security software from filtering out my pop-up windows."
【CSS】
The "CSS Streaking Festival" is here! Use this to test how your page looks when CSS is streaking. This is also an important test to verify the robustness and accessibility of the page. Although, there are not many blind people in China who can access the web now.
This article has briefly explained each menu of the developer tools. I believe that everyone can already use this powerful tool easily.
[View] menu 
[Class and ID information]
The shortcut key is Ctrl I, parity switch. After opening it, you will see that the page is covered with dense red color blocks. At the same time, the class name or ID name will be displayed. Yes, this is the effect of viewing class and ID information. But let’s be honest, who would be interested in this red poop? Not only does it make the page look like a patched beggar’s uniform, but it’s also completely unclear -_-b... 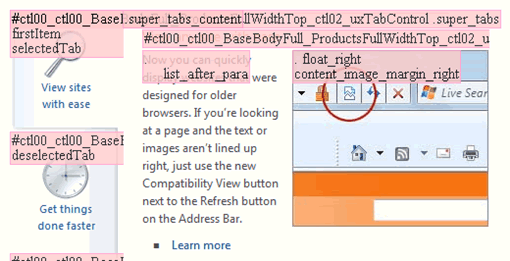
[Link path]
Same as above. It will highlight all hyperlinks on the page in red boxes and display their link addresses. 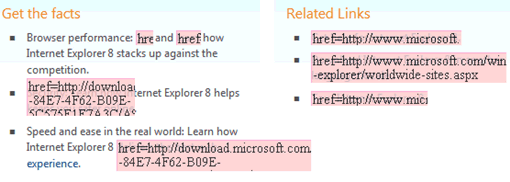
[Link Report]
Using the link report function, the developer tools will help you generate a link report for this page. Contains information such as the number of links, link address, whether a new window is opened, etc. However, what is the specific use of this thing? I don't know either. 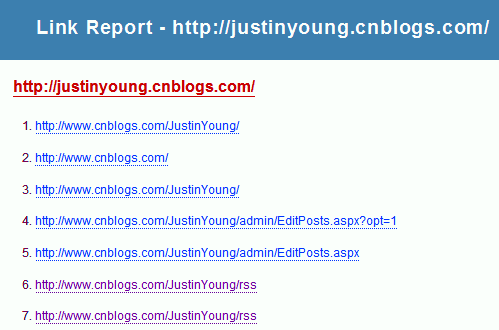
[Tab Index]
Highlights all elements containing the tabindex attribute. Setting the tabindex attribute can change the order in which web page elements gain focus.
This article has briefly explained each menu of the developer tools. I believe that everyone can already use this powerful tool easily.
[Access Key]
Highlight all elements containing the "accesskey attribute". Set the accesskey attribute to set the shortcut key for the element to gain focus. 
【Source file】"Element source with style"
Generate a source file containing the selected element style, HTML code, and web page level information.
An element must be selected first for this command to be effective. Moreover, the generated source file is only related to the selected element.
[Source File] "DOM (Element)"
The shortcut key is Ctrl T. Generate a source file. This source file only contains the DOM structure information of the selected element. Friends who have used FireBug can think of the command "copy element HTML code". In fact, this one is almost the same as that one. It's just that this is generated into a window, and FireBug copies it directly to the clipboard.
[Source File] "DOM (Page)"
Shortcut key Ctrl G. Generate a source file. This source file contains the DOM information structure of the entire page. It’s a very fucked-up function. I don’t know if it’s because of a bug. This function is actually “view the source code of the web page”. Because the generated source code is not just DOM information, but also includes CSS and script information.
The "original state" of [source file]
The extremely fucking function is actually "view the source code of the web page". Everyone probably prefers to use the right mouse button to click directly on the web page.
[Outline] menu 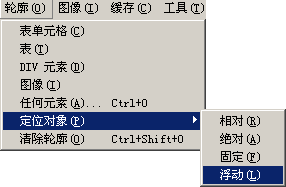
[Outline] menu is obviously a command to outline and display elements that meet the conditions.
【Table Cell】
Just use orange lines to frame each cell in the form table. Just to let you know - oh. It turns out that this is the cell of the table. 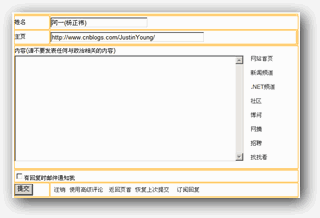
【Form】
is to frame the form with orange lines. Just to let you know - oh. It turns out that this is the form.
[DIV element]
is to use green lines to frame all div elements in the page. Just to let you know - oh. It turns out that these are all div elements. 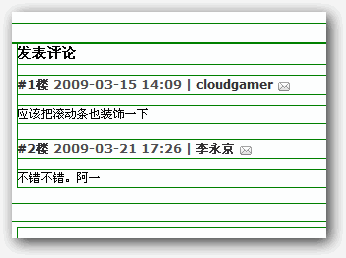
This article has briefly explained each menu of the developer tools. I believe that everyone can already use this powerful tool easily.
【Image】
is to use purple lines to frame all img elements in the page. Just to let you know - oh. It turns out that these are all img elements. 
[Any element]
This is relatively powerful. You can customize any label and what color wireframe they want to use. Click this menu and the following dialog box will pop up. Very simple. No more explanation. 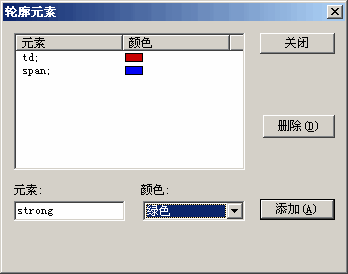
The "relative" of [Positioned Element]
will be outlined with a green line for all elements with the position:relative style.
[Positioned element]'s "absolute"
will be outlined with a black line for all elements with the position:absolute style.
[Positioned element]'s "fixed"
will be outlined with a blue line for all elements with position:static style. The "floating"
of
[Positioned Element] will be outlined with a yellow line for all elements with float style.
【Clear Outlines】
When your page has been made like an Excel table by lines of various colors, you can use this command to clear all the lines. 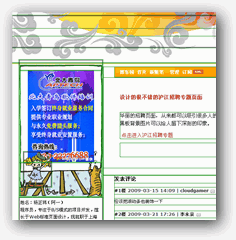
This article has briefly explained each menu of the developer tools. I believe that everyone can already use this powerful tool easily.
[Image] menu 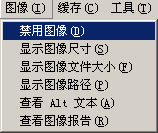
Obviously, this command controls various images on the page.
【Disabled Images】
In order not to insult your intelligence, I won’t say this. The only thing that needs to be explained is that not only the img element, but also the background image of the element will be disabled.
【Show image size】
Very good function. You can quickly know the size of each image without checking the image properties. Of course, the unit is pixels. 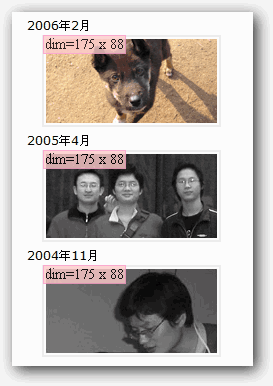
[Show image file size]
A very good function. You can quickly know the file size of each image without checking the image properties. Of course, the unit is bytes. 
[Show image path]
A very good function. You can quickly know the URL path of each image without checking the image properties, and you can also copy it. 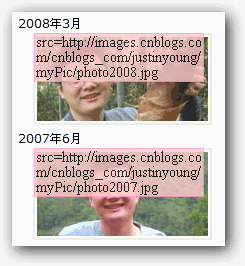
[Show Alt text]
You can display the text of the alt attribute of the img element. By the way: Do not pile keywords in the alt of the image, otherwise it will easily be identified as SEO transition optimization. 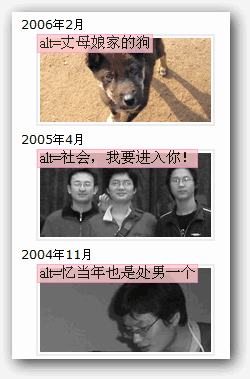
【View Image Report】
Generate a detailed image report of the changed page. Contains very detailed information about each image. 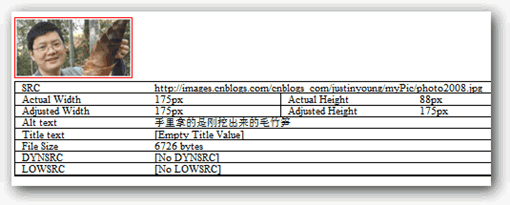
This article has briefly explained each menu of the developer tools. I believe that everyone can already use this powerful tool easily.
[Cache] Menu 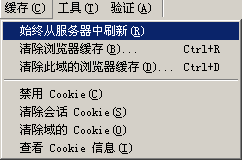
Menu group for managing cache and cookies. This will be a very welcome feature for developers.
【Always refresh from server】
It seems like a very profound command. In fact, in other words: "Disable the use of browser cache."
【Clear browser cache】
Shortcut key Ctrl R. There’s not much to say, it’s just a simplification of the previous steps.
I wonder if you noticed there are three dots after [Clear Browser Cache] in the menu. This means that clicking this menu will prompt a confirmation dialog box.
【Clear browser cache for this domain】
Shortcut key Ctrl D. There’s nothing much to say, just clear the browser cache for this domain.
【Disable Cookies】
Nothing good to say. No more cookies.
【Clear Session Cookies】
Clear all cookies in the browser. Your forums and communities are all waiting to be logged in again.
【Clear domain cookies】
Only clear cookies for this domain.
【View Cookie Information】
View the cookie information contained on this page. Don't even think about it, you won't get the password.
[Tools] menu 
There are some useful gadgets included with the developer tools, although they are a bit weak compared to other specialized related tools. But emergency response is enough.
【Resize】
Very useful gadget. You can quickly adjust the browser window to the relevant size. In this way, it will be much more convenient to test the compatibility of web page resolution.
【Show ruler】
A simple ruler tool. Use it to measure length, distance and other information. The color of the thread can be changed. Multiple titles can also be created. If the area is too small, you can use the magnifying glass function. 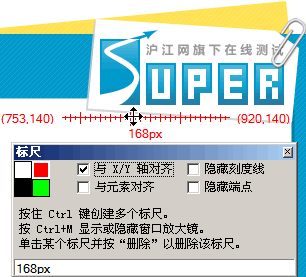
【Show color picker】
A simple color picking tool. Colors can be selected with a click of the mouse. However, I recommend another tool to you - "My Work Toolbox - Color Picking Tool (ColorPic)". In comparison, this one in the developer tools is too simple. 
This article has briefly explained each menu of the developer tools. I believe that everyone can already use this powerful tool easily.
[Verification] Menu 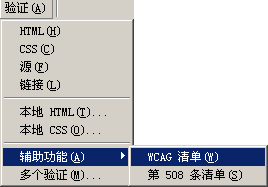
It will definitely cause a bloody storm in the world (Thank you, Xiaoqi, for reminding me of this idiom that I suddenly forgot. Alas~ maybe the latest martial arts novel I read is more Probably because of the lack of it. But lately I seem to be more familiar with the idiom "panting again and again") menu. There will be countless Kong Yijis in the near future.
【HTML】
Verify the HTML code of the page. This page will be sent to w3c's html verification tool and a verification report will be obtained.
【CSS】
Verify the CSS code of the page. This page will be sent to w3c's css verification tool and a verification report will be obtained.
【Source】
Verify the source file code of the page. This page will be sent to the feedvalidator.org verification tool and a verification report will be obtained.
[Link]
Link to the verification page. This page will be sent to w3c's verification tool and a verification report will be obtained.
[Local HTML]
Open w3c's html verification tool to verify local pages.
[Local CSS]
Open w3c's CSS verification tool to verify local pages.
[Accessibility] "WCAG Checklist"
Verify the WCAG (Web Content Accessibility Report-page accessibility) of the page. This page will be sent to the contentquality.com verification tool and a verification report will be obtained.
【Accessibility】"508 List"
Verify the 508 Standards of the page. This page will be sent to the contentquality.com verification tool and a verification report will be obtained.
【Multiple Verifications】
Simultaneous verification performs multiple standard verifications on the page. 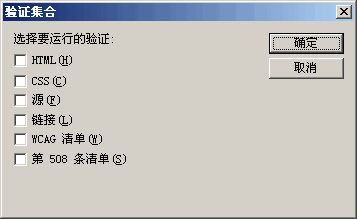
Regarding page verification, I would like to say two things: In fact, does the page also need to pass verification before it can go online? I personally feel it's completely unnecessary. If you are a student, lie in the ivory tower. You can do whatever you want with your page, because you are the customer and you have time. But for commercial projects, there is no need to waste precious project resources just for a "PASS". Because no customer will care, "Look, this page I made has been verified by W3C in many aspects." If there are customers who really care, then I can only say that I admire your ability to "fool".
Please look forward to the next episode
This article has briefly explained each menu of the developer tools. I believe that everyone can already use this powerful tool easily.
But we haven’t talked about the more powerful functions yet. All, please look forward to our next article. The next article will explain in detail the use of JavaScript debugging, browser mode, text mode and other functions.

Hot AI Tools

Undresser.AI Undress
AI-powered app for creating realistic nude photos

AI Clothes Remover
Online AI tool for removing clothes from photos.

Undress AI Tool
Undress images for free

Clothoff.io
AI clothes remover

AI Hentai Generator
Generate AI Hentai for free.

Hot Article

Hot Tools

Notepad++7.3.1
Easy-to-use and free code editor

SublimeText3 Chinese version
Chinese version, very easy to use

Zend Studio 13.0.1
Powerful PHP integrated development environment

Dreamweaver CS6
Visual web development tools

SublimeText3 Mac version
God-level code editing software (SublimeText3)

Hot Topics
 1359
1359
 52
52
 Gitee Pages static website deployment failed: How to troubleshoot and resolve single file 404 errors?
Apr 04, 2025 pm 11:54 PM
GiteePages static website deployment failed: 404 error troubleshooting and resolution when using Gitee...
 How to manually trigger the onBlur event of a cell in Avue-crud row editing mode?
Apr 04, 2025 pm 02:00 PM
The onBlur event that implements Avue-crud row editing in the Avue component library manually triggers the Avue-crud component. It provides convenient in-line editing functions, but sometimes we need to...
 How to quickly build a foreground page in a React Vite project using AI tools?
Apr 04, 2025 pm 01:45 PM
How to quickly build a front-end page in back-end development? As a backend developer with three or four years of experience, he has mastered the basic JavaScript, CSS and HTML...
 How to use browser embedded scripts to automate web page elements operations and numerical calculations?
Apr 04, 2025 pm 12:09 PM
Web page automation and numerical calculation: Implementation based on browser embedded scripts This article will explore how to use browser embedded scripts to implement web page elements operations and numbers...
 How to effectively modify and replay requested cookies in Chrome DevTools?
Apr 04, 2025 pm 05:48 PM
How to effectively modify and replay requested cookies in ChromeDevTools using Chrome...
 How to create a React application with pnpm instead of npm?
Apr 04, 2025 pm 06:45 PM
About using pnpm instead of npm to create a React application using npx...
 How to achieve gap effect on the card and coupon layout with gradient background?
Apr 05, 2025 am 07:48 AM
Realize the gap effect of card coupon layout. When designing card coupon layout, you often encounter the need to add gaps on card coupons, especially when the background is gradient...
 How to use JavaScript plug-in to achieve the effect of page fixation and element independent movement?
Apr 04, 2025 pm 12:51 PM
Implementing the page fixing effect of independently moving scroll bars and elements In web design, sometimes we need to achieve a special effect, that is, when the scroll bars scroll...


