Let’s deal with the first problem first: 1. View the recommended function source code called by this function at the bottom of the article
It's actually very simple, just click the magnifying glass to select the recommendation.

This votePost(cb_entryId,'Digg') is the function called by the recommendation button. Isn't it very simple?
The second question is to locate the file location where the function is located.
In fact, it is very simple. Of course, friends who are not familiar with consoles may not know how to see it.
I type votePost in the console and hit enter,

The function source code is boldly displayed, and there is a link blog-common.js?v=WE8o1xrgcTu07QVvwYqERqD7AA8fdJp_dgoE-crAT3k1:1 in the lower right corner. What does this mean?
The following v=WE8o1xrgcTu07QVvwYqERqD7AA8fdJp_dgoE-crAT3k1 is simply ignored.
ps: If you want to know what this is, it is actually a version number. As for its function, it is often to prevent caching. Search online for details.
blog-common.js:1 That’s pretty much what it means. .
blog-common.js is the js file where this function is located
1 is the line number of the code.
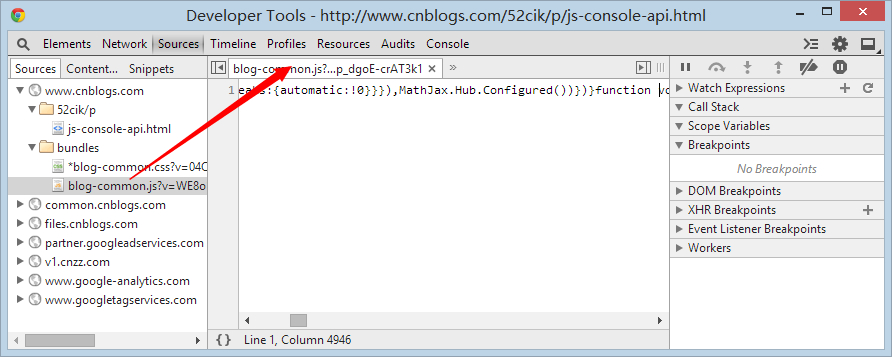
Click this link directly to jump to the Sources panel. This is the source code panel. The most important function for debugging will be introduced later.

But all the code is on one line, how should we change it? There are 4946 characters, all condensed on one line. .
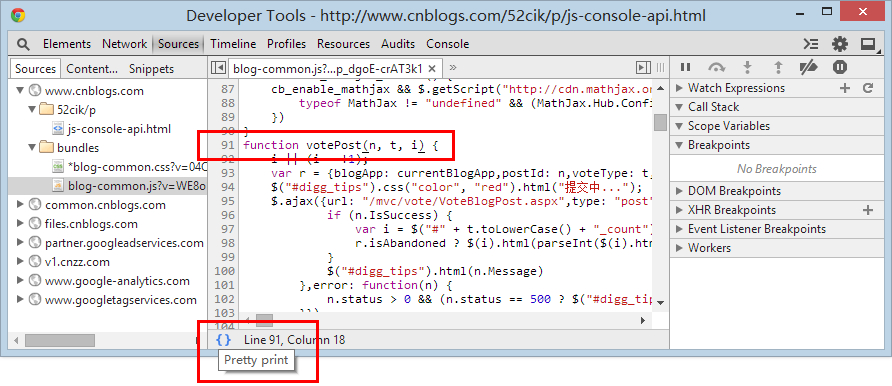
Chrome provides us with a code formatting function. Click the Pretty print button below to format the code.

After the formatting is completed, the code will be very beautiful. As for whether it can be read or understood, that is another matter.
If you don't understand it, it may be that the code has been compiled by tools such as UglifyJS and Google's Closure, such as the jquery.min.js file.
It’s also possible that your level is too low and you can’t understand the code written by the master for the time being. Then there’s nothing I can do about it. You can only work hard to improve your strength.
If you can’t find the location of the function after formatting, don’t worry. I’m here, so why panic?
Return to the console panel just now.

You are delighted to discover, blog-common.js?v=WE8o1xrgcTu07QVvwYqERqD7AA8fdJp_dgoE-crAT3k1:91
The line number has changed to 91. Now click this link to jump to the corresponding formatted position. Isn’t it super convenient? .
The last question is to modify the function to make it invalid. This is the simplest, much simpler than the previous one, but many people don’t know how to operate it, so I will explain it here.
First of all, we know that the function called by the recommendation function is votePost(cb_entryId,'Digg'), and it is written directly on the html and bound through onclick.
So this function is a global function and can be called everywhere, so what does this mean?
It means that we can modify it, just like a global variable, you can modify it anywhere, right, so the global function should also be the same.
So we can directly modify it to an empty function.
votePost = function () {}; or votePost = $.noop; both work. $.noop is an empty function provided by jQuery for our convenience.

Now votePost is an empty function, so nothing will happen when you click the Recommend button.
Of course, it will take effect again after refreshing the page. We are just debugging the changes on the page. Without changing the source code of the blog park, it is impossible to take effect permanently.
So debugging means the process of finding and eliminating errors. If the source of the error is located, modify it and then test it. If it is wrong, refresh and modify it again, so that there is no need to modify the actual file and cause it to be unrecoverable.
That’s about it for today. In fact, there are very few direct global functions for you to debug, because jQuery is now popular and various click, on and other event bindings make source code positioning very cumbersome.
Fortunately, I wrote an article before that analyzed this issue in more detail. For details, please refer to "A Brief Discussion on jQuery Event Source Code Positioning Issues"
I'm not familiar with other frameworks, so I didn't analyze them, but the ideas are actually similar, and there must be an event management mechanism.
There are not many knowledge points today, but you have to consolidate them by yourself, otherwise you will forget them instantly.
After-class exercises:
1. Analyze how the votePost function is implemented and recommended.
2. Dynamic debugging and analysis of votePost. (Must be combined with breakpoint knowledge)
Tomorrow I’m going to talk about breakpoints and dynamic debugging. I haven’t found a suitable topic, so I’ll just make do with it. If you have something suitable that needs dynamic debugging, please leave a comment. .
 How to restore Bluetooth headset to binaural mode
 What browser is edge?
 Win10 does not support the disk layout solution of Uefi firmware
 How to use dict function in Python
 What are the differences between hibernate and mybatis
 What should I do if iis cannot start?
 what does bbs mean
 Advantages and Disadvantages of Free Overseas Website Servers


