
 Web Front-end
JS Tutorial
js debugging series first introduction to the console_javascript skills
Web Front-end
JS Tutorial
js debugging series first introduction to the console_javascript skills
js debugging series first introduction to the console_javascript skills

Written at the beginning: In fact, I was thinking about whether to write this thing before, because it is really not difficult, but why do so many people ask? What they ask is not how to use the console, but how to control it. What can the station do? They also know that there are things like console.log, but they don't know why such a long string is used instead of alert to output information. In their eyes, alert is enough. Okay, I admit that I made a small complaint, but in this series I only intend to introduce the basic knowledge of debugging, and will not go into too much depth, because in-depth things are combined with js knowledge. If you have not reached a certain level of js, I will teach you You debug bugs, crack some plug-ins, etc., and you have no idea what I am doing. My purpose is just to let you know the console and let you get started with debugging. You will have to walk the road on your own after that.
Of course, heroes, please pass by, or you can just complain. .
js debugging series directory:
In fact, everyone who does web development knows this, whether it is front-end or back-end, but many people only stay at HTML viewing and CSS modification, and do not use the console at all.
Maybe some people who are just starting out don’t know this exists. .
There is a lot of information on this thing online, but they don't talk about debugging, they just introduce the basic how to use it. .
Whether it is Chrome Firefox IE (version 8 or above) or 360 Rapid Browser Sogou Browser, etc., just press F12 to open the console.
Our article uses chrome as an example. No reason, because I like chrome. . Everyone has their own preferences for radish and cabbage. .
ps: ff The world used to be dominated by firebug, but now the native one is also very good.
Now we press F12 to open the console and click on the Console item.

You can see my avatar and a few lines of text, but there are a few lines below, which we will ignore for now and will be explained later.
In fact, for this F12, the most accurate name is developer tools, and Console is the console.
PS: As a basic tutorial, I will only introduce the debugging of Console and Sources. You can learn about other functions by yourself. .
Right-click the Clear console menu or type clear() and press Enter to clear the console content.
Let’s take the first step and use console.log to output information.
Enter console.log("hehe..") and console.log("hehe..", "haha..") respectively and press Enter. You can see the output results on the console.
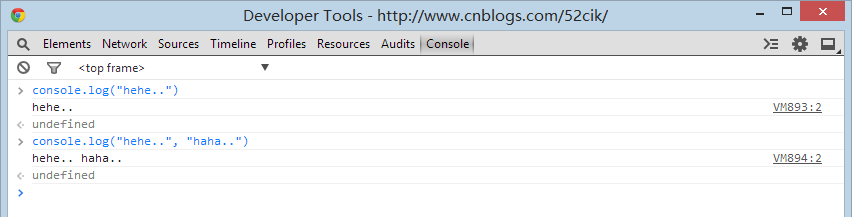
In fact, it just outputs information, which is very simple. Use it to replace alert and document.write for debugging, and your work will become very easy.
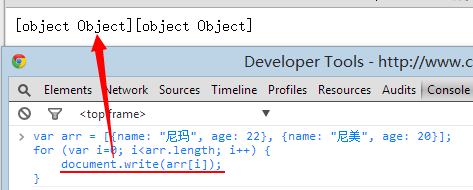
For example, when debugging a loop of code, but there are dozens or even hundreds of elements in the array, you will go crazy if you click alert,
document.write is not impossible, but for object output, you can only see things like [object Object].
This is a real problem encountered by many newcomers.
If you use console.log instead of alert document.write to output object information, you can expand the object in the console to view specific information.
For example:
var arr = [{name: "尼玛", age: 22}, {name: "尼美", age: 20}];
for (var i=0; i<arr.length; i++) {
	console.log(arr[i]);
}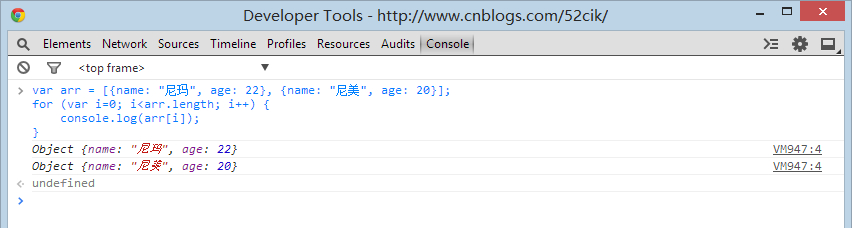
You can directly see the object information without displaying [object Object] which makes us confused.
Did you suddenly feel that console.log was awesome?
In fact, this is just the tip of his iceberg. I will try my best to show you some of his advantages.
Continuing with the previous steps, now we directly enter arr and press Enter.
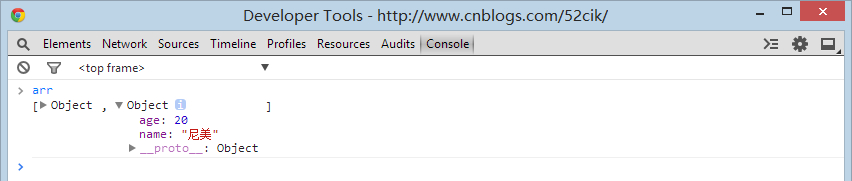
Isn’t it even more interesting? Now you can directly click Object to expand the objects in this array for viewing, and even the loop output is omitted.
This is the charm of the console, and this is just its most basic function.
Let’s first understand what methods are available for us to use under the console object.
Type console and press Enter to expand this object,
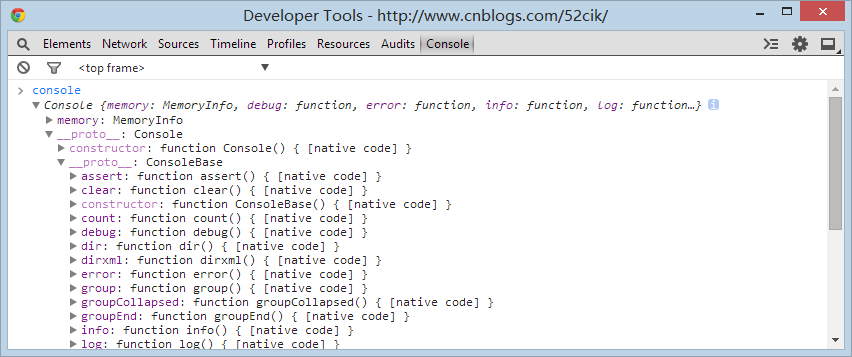
You can see some dark and light things. The dark ones are methods that we can call directly. The light ones represent default attributes or methods. You don’t need to care about the display. We will talk about it later when we have the opportunity.
In fact, only log dir is commonly used. Others are rarely used and will only be used in advanced debugging.
Auxiliary properties such as group and table can be used or not, depending on your preference. I don't really like using it.
Let’s take a look step by step. Anyway, let’s start with the log dir. Most of the debugging depends on them.
PS: In fact, I should give you official documents, but recently it cannot be opened on Google, so you can check the functions of each method on Baidu.
I found a Chinese version, which is pretty good. Please read "console object" first.
Let’s do some after-class exercises: (First open Baidu, then open the console)
1 View the element information with ID kw1 in the console
2 Then use the console.dir method to view the information of the kw1 element

Hot AI Tools

Undresser.AI Undress
AI-powered app for creating realistic nude photos

AI Clothes Remover
Online AI tool for removing clothes from photos.

Undress AI Tool
Undress images for free

Clothoff.io
AI clothes remover

Video Face Swap
Swap faces in any video effortlessly with our completely free AI face swap tool!

Hot Article
Hot Tools

Notepad++7.3.1
Easy-to-use and free code editor

SublimeText3 Chinese version
Chinese version, very easy to use

Zend Studio 13.0.1
Powerful PHP integrated development environment

Dreamweaver CS6
Visual web development tools

SublimeText3 Mac version
God-level code editing software (SublimeText3)
Hot Topics
 1393
1393
 52
1209
24
52
1209
24

 Detailed explanation of C++ function debugging: How to debug problems in multi-threaded functions?
May 02, 2024 pm 04:15 PM
Detailed explanation of C++ function debugging: How to debug problems in multi-threaded functions?
May 02, 2024 pm 04:15 PM
C++ multi-thread debugging can use GDB: 1. Enable debugging information compilation; 2. Set breakpoints; 3. Use infothreads to view threads; 4. Use thread to switch threads; 5. Use next, stepi, and locals to debug. Actual case debugging deadlock: 1. Use threadapplyallbt to print the stack; 2. Check the thread status; 3. Single-step the main thread; 4. Use condition variables to coordinate access to solve the deadlock.
 How to use LeakSanitizer to debug C++ memory leaks?
Jun 02, 2024 pm 09:46 PM
How to use LeakSanitizer to debug C++ memory leaks?
Jun 02, 2024 pm 09:46 PM
How to use LeakSanitizer to debug C++ memory leaks? Install LeakSanitizer. Enable LeakSanitizer via compile flag. Run the application and analyze the LeakSanitizer report. Identify memory allocation types and allocation locations. Fix memory leaks and ensure all dynamically allocated memory is released.
 Shortcut to golang function debugging and analysis
May 06, 2024 pm 10:42 PM
Shortcut to golang function debugging and analysis
May 06, 2024 pm 10:42 PM
This article introduces shortcuts for Go function debugging and analysis, including: built-in debugger dlv, which is used to pause execution, check variables, and set breakpoints. Logging, use the log package to record messages and view them during debugging. The performance analysis tool pprof generates call graphs and analyzes performance, and uses gotoolpprof to analyze data. Practical case: Analyze memory leaks through pprof and generate a call graph to display the functions that cause leaks.
 How to do efficient debugging in Java lambda expressions?
Apr 24, 2024 pm 12:03 PM
How to do efficient debugging in Java lambda expressions?
Apr 24, 2024 pm 12:03 PM
Efficiently debug Lambda expressions: IntelliJ IDEA Debugger: Set breakpoints on variable declarations or methods, inspect internal variables and state, and see the actual implementation class. Java9+JVMTI: Connect to the runtime JVM to obtain identifiers, inspect bytecode, set breakpoints, and monitor variables and status during execution.
 How to debug PHP asynchronous code
May 31, 2024 am 09:08 AM
How to debug PHP asynchronous code
May 31, 2024 am 09:08 AM
Tools for debugging PHP asynchronous code include: Psalm: a static analysis tool that can find potential errors. ParallelLint: A tool that inspects asynchronous code and provides recommendations. Xdebug: An extension for debugging PHP applications by enabling a session and stepping through the code. Other tips include using logging, assertions, running code locally, and writing unit tests.
 How to conduct concurrency testing and debugging in Java concurrent programming?
May 09, 2024 am 09:33 AM
How to conduct concurrency testing and debugging in Java concurrent programming?
May 09, 2024 am 09:33 AM
Concurrency testing and debugging Concurrency testing and debugging in Java concurrent programming are crucial and the following techniques are available: Concurrency testing: Unit testing: Isolate and test a single concurrent task. Integration testing: testing the interaction between multiple concurrent tasks. Load testing: Evaluate an application's performance and scalability under heavy load. Concurrency Debugging: Breakpoints: Pause thread execution and inspect variables or execute code. Logging: Record thread events and status. Stack trace: Identify the source of the exception. Visualization tools: Monitor thread activity and resource usage.
 What are the debugging techniques for recursive calls in Java functions?
May 05, 2024 am 10:48 AM
What are the debugging techniques for recursive calls in Java functions?
May 05, 2024 am 10:48 AM
The following techniques are available for debugging recursive functions: Check the stack traceSet debug pointsCheck if the base case is implemented correctlyCount the number of recursive callsVisualize the recursive stack
 PHP Debugging Errors: A Guide to Common Mistakes
Jun 05, 2024 pm 03:18 PM
PHP Debugging Errors: A Guide to Common Mistakes
Jun 05, 2024 pm 03:18 PM
Common PHP debugging errors include: Syntax errors: Check the code syntax to make sure there are no errors. Undefined variable: Before using a variable, make sure it is initialized and assigned a value. Missing semicolons: Add semicolons to all code blocks. Function is undefined: Check that the function name is spelled correctly and make sure the correct file or PHP extension is loaded.
