

使用10046查看执行计划并读懂trace文件

查看 sql 执行计划的方法有许多种, 10046 事件就是其中的一种. 与其他查看 sql 执行计划不同, 当我们遇到比较复杂的 sql 语句, 我们可以通过 10046 跟踪 sql 得到执行计划中每一个步骤的逻辑读, 物理读以及花费的时间等. 这种细粒度的跟踪对于我们分析 sql 性
查看 sql 执行计划的方法有许多种, 10046 事件就是其中的一种. 与其他查看 sql 执行计划不同, 当我们遇到比较复杂的 sql 语句, 我们可以通过 10046 跟踪 sql 得到执行计划中每一个步骤的逻辑读, 物理读以及花费的时间等. 这种细粒度的跟踪对于我们分析 sql 性能尤其有用.一般来说, 使用 10046 事件得到 sql 执行计划的步骤如下:
1. 激活当前 session 10046 事件
2. 在当前 session 中执行 sql 语句
3. 关闭当前 session 10046 事件
执行完上述步骤后, 通常会自动生成一个 trace 文件. 在 oracle 11g 中, trace 文件一般放在$ORACLE_BASE/diag/rdbms/{database_name}/$ORACLE_SID/trace 目录下. 如果使用 oradebug 激活跟踪 10046后, 可以使用 oradebug tracefile_name 得到刚刚生成的 trace 文件的完整路径.
NAME                                 TYPE        VALUE
------------------------------------ ----------- ------------------------------
background_dump_dest                 string      g:\app\davidd\diag\rdbms\david
\david\trace刚刚提到的 oradebug 激活跟踪 10046 事件, 我想大部分 dba 都会使用. oradebug 是个功能强大非常好用的工具, 使用 oradebug help 将会看到它的功能很多
SQL> oradebug help HELP [command] Describe one or all commands SETMYPID Debug current process SETOSPID <ospid> Set OS pid of process to debug SETORAPID <orapid> ['force'] Set Oracle pid of process to debug SETORAPNAME <orapname> Set Oracle process name to debug SHORT_STACK Get abridged OS stack CURRENT_SQL Get current SQL DUMP <dump_name> <lvl> [addr] Invoke named dump DUMPSGA [bytes] Dump fixed SGA DUMPLIST Print a list of available dumps EVENT <text> Set trace event in process SESSION_EVENT <text> Set trace event in session DUMPVAR <p|s|uga> <name> [level] Print/dump a fixed PGA/SGA/UGA variable DUMPTYPE <address> <type> <count> Print/dump an address with type info SETVAR <p|s|uga> <name> <value> Modify a fixed PGA/SGA/UGA variable PEEK <addr> <len> [level] Print/Dump memory POKE <addr> <len> <value> Modify memory WAKEUP <orapid> Wake up Oracle process SUSPEND Suspend execution RESUME Resume execution FLUSH Flush pending writes to trace file CLOSE_TRACE Close trace file TRACEFILE_NAME Get name of trace file LKDEBUG Invoke global enqueue service debugger NSDBX Invoke CGS name-service debugger -G <Inst-List | def | all> Parallel oradebug command prefix -R <Inst-List | def | all> Parallel oradebug prefix (return output SETINST <instance# .. | all> Set instance list in double quotes SGATOFILE <SGA dump dir> Dump SGA to file; dirname in double quotes DMPCOWSGA <SGA dump dir> Dump & map SGA as COW; dirname in double quotes MAPCOWSGA <SGA dump dir> Map SGA as COW; dirname in double quotes HANGANALYZE [level] [syslevel] Analyze system hang FFBEGIN Flash Freeze the Instance FFDEREGISTER FF deregister instance from cluster FFTERMINST Call exit and terminate instance FFRESUMEINST Resume the flash frozen instance FFSTATUS Flash freeze status of instance SKDSTTPCS <ifname> <ofname> Helps translate PCs to names WATCH <address> <len> <self|exist|all|target> Watch a region of memory DELETE <local|global|target> watchpoint <id> Delete a watchpoint SHOW <local|global|target> watchpoints Show watchpoints DIRECT_ACCESS <set/enable/disable command | select query> Fixed table access CORE Dump core without crashing process IPC Dump ipc information UNLIMIT Unlimit the size of the trace file PROCSTAT Dump process statistics CALL <func> [arg1] ... [argn] Invoke function with arguments
SQL> oradebug setmypid
Statement processed.

// 激活 10046 事件
SQL> oradebug event 10046 trace name context forever,level 12;
Statement processed.

SQL> select /*+ leading(t3) use_merge(t4) */ *
  2  from t3, t4
  3  where t3.id = t4.t3_id and t3.n = 1100;

10 rows selected.

// 在当前 session 关闭 10046 事件
SQL> oradebug event 10046 trace name context off;
Statement processed.

// 使用 oradebug tracefile_name 可以直接看到生成的 trace 文件的位置
SQL> oradebug tracefile_name;
g:\app\davidd\diag\rdbms\david\david\trace\david_ora_2176.trc
其中, 10046 按照收集信息的内容分为以下等级:
| Level 0 | 停用SQL跟踪,相当于SQL_TRACE=FALSE |
| Level 1 | 标准SQL跟踪,相当于SQL_TRACE=TRUE |
| Level 4 | 在level 1的基础上增加绑定变量的信息 |
| Level 8 | 在level 1的基础上增加等待事件的信息 |
| Level 12 | 在level 1的基础上增加绑定变量和等待事件的信息 |
分析读懂 trace 文件
现在我们打开 g:\app\davidd\diag\rdbms\david\david\trace\david_ora_2176.trc 看看生成的 trace 文件的内容
<pre name="code" class="sql"><pre name="code" class="sql"><pre name="code" class="sql"><pre name="code" class="sql" style="font-size:14px;">PARSING IN CURSOR #22 len=92 dep=0 uid=0 oct=3 lid=0 tim=900460923321 hv=1624778336 ad='34671d90' sqlid='g0rdyg9hdh9m0' select /*+ leading(t3) use_merge(t4) */ * from t3, t4 where t3.id = t4.t3_id and t3.n = 1100 END OF STMT PARSE #22:c=0,e=10777,p=0,cr=0,cu=0,mis=1,r=0,dep=0,og=1,plh=3831111046,tim=900460923319 EXEC #22:c=0,e=29,p=0,cr=0,cu=0,mis=0,r=0,dep=0,og=1,plh=3831111046,tim=900460923482 WAIT #22: nam='SQL*Net message to client' ela= 2 driver id=1111838976 #bytes=1 p3=0 obj#=-1 tim=900460923512 FETCH #22:c=15625,e=23922,p=0,cr=119,cu=0,mis=0,r=1,dep=0,og=1,plh=3831111046,tim=900460947462 WAIT #22: nam='SQL*Net message from client' ela= 221 driver id=1111838976 #bytes=1 p3=0 obj#=-1 tim=900460947755 WAIT #22: nam='SQL*Net message to client' ela= 2 driver id=1111838976 #bytes=1 p3=0 obj#=-1 tim=900460947803 FETCH #22:c=0,e=71,p=0,cr=0,cu=0,mis=0,r=9,dep=0,og=1,plh=3831111046,tim=900460947864 STAT #22 id=1 cnt=10 pid=0 pos=1 obj=0 op='MERGE JOIN (cr=119 pr=0 pw=0 time=28 us cost=193 size=1280 card=10)' STAT #22 id=2 cnt=1 pid=1 pos=1 obj=0 op='SORT JOIN (cr=15 pr=0 pw=0 time=0 us cost=6 size=63 card=1)' STAT #22 id=3 cnt=1 pid=2 pos=1 obj=83550 op='TABLE ACCESS FULL T3 (cr=15 pr=0 pw=0 time=0 us cost=5 size=63 card=1)' STAT #22 id=4 cnt=10 pid=1 pos=2 obj=0 op='SORT JOIN (cr=104 pr=0 pw=0 time=11 us cost=187 size=650000 card=10000)' STAT #22 id=5 cnt=10000 pid=4 pos=1 obj=83552 op='TABLE ACCESS FULL T4 (cr=104 pr=0 pw=0 time=8603 us cost=29 size=650000 card=10000)'
从上面的 trace 文件我们可以看出 sql 语句经过了 parse(解析) -> exec(执行) -> fetch(从游标中获取数据) 几个过程, 其中第一句说明了当前跟踪执行的 sql 语句的概况,比如使用游标号, sql 语句的长度, 递归深度等等基本信息:
PARSING IN CURSOR #22 len=92 dep=0 uid=0 oct=3 lid=0 tim=900460923321 hv=1624778336 ad='34671d90' sqlid='g0rdyg9hdh9m0'
| cursor | cursor number |
| len | sql 语句长度 |
| dep | sql 语句递归深度 |
| uid | user id |
| oct | oracle command type |
| lid | privilege user id |
| tim | timestamp,时间戳 |
| hv | hash id |
| ad | sql address 地址, 用在 v$sqltext |
| sqlid | sql id |
接着, 下面的语句说明了 sql 语句具体的执行过程以及每一个步骤消耗 CPU 的时间等性能指标
PARSE #22:c=0,e=10777,p=0,cr=0,cu=0,mis=1,r=0,dep=0,og=1,plh=3831111046,tim=900460923319
EXEC #22:c=0,e=29,p=0,cr=0,cu=0,mis=0,r=0,dep=0,og=1,plh=3831111046,tim=900460923482
FETCH #22:c=15625,e=23922,p=0,cr=119,cu=0,mis=0,r=1,dep=0,og=1,plh=3831111046,tim=900460947462
| c | CPU 消耗的时间 |
| e | Elapsed time |
| p | number of physical reads 物理读的次数 |
| cr | number of buffers retrieved for CR reads 逻辑读的数据块 |
| cu | number of buffers retrieved in current mode (current 模式读取的数据块) |
| mis | cursor missed in the cache 库缓存中丢失的游标, 硬解析次数 |
| r | number of rows processed 处理的行数 |
| dep | 递归深度 |
| og | optimizer mode 【1:all_rows, 2:first_rows, 3:rule, 4:choose】 |
| plh | plan hash value |
| tim | timestamp 时间戳 |
以及执行过程中的发生的等待事件
WAIT #22: nam='SQL*Net message to client' ela= 2 driver id=1111838976 #bytes=1 p3=0 obj#=-1 tim=900460923512
| nam | an event that we waited for 等待事件 |
| ela | 此操作消耗的时间 |
| p3 | block 块号 |
| trm | timestamp 时间戳 |
最后显示的是该游标的执行计划
STAT #22 id=1 cnt=10 pid=0 pos=1 obj=0 op='MERGE JOIN  (cr=119 pr=0 pw=0 time=28 us cost=193 size=1280 card=10)'
STAT #22 id=2 cnt=1 pid=1 pos=1 obj=0 op='SORT JOIN (cr=15 pr=0 pw=0 time=0 us cost=6 size=63 card=1)'
STAT #22 id=3 cnt=1 pid=2 pos=1 obj=83550 op='TABLE ACCESS FULL T3 (cr=15 pr=0 pw=0 time=0 us cost=5 size=63 card=1)'
STAT #22 id=4 cnt=10 pid=1 pos=2 obj=0 op='SORT JOIN (cr=104 pr=0 pw=0 time=11 us cost=187 size=650000 card=10000)'
STAT #22 id=5 cnt=10000 pid=4 pos=1 obj=83552 op='TABLE ACCESS FULL T4 (cr=104 pr=0 pw=0 time=8603 us cost=29 size=650000 card=10000
| cnt | 当前行源返回的行数 |
| pid | parent id of this row source 当前行源的父结点 id |
| pos | position in explain plan 执行计划的位置 |
| obj | object id of row source (if this is a base object) |
| op | the row source access operation |
例如, 执行步骤 merge join 消耗的逻辑读为 119, 物理读为 0, 耗费的时间为 28 us, 成本 cost 193,返回 10 条记录
使用 tkprof 命令翻译 trace 文件
我们也可以使用 tkprof 命令对 trace 文件进行翻译,得到一个容易理解的 trace 汇总报表文件
C:\Documents and Settings\davidd> tkprof g:\app\davidd\diag\rdbms\david\david\trace\david_ora_2176.trc d:\trace.trc

TKPROF: Release 11.2.0.1.0 - Development on Thu Dec 18 18:51:44 2014

Copyright (c) 1982, 2009, Oracle and/or its affiliates.  All rights reserved.
tkprof 翻译的 trace 文件的汇总报表如下:
Trace file: g:\app\davidd\diag\rdbms\david\david\trace\david_ora_2176.trc
Sort options: default


********************************************************************************
count    = number of times OCI procedure was executed
cpu      = cpu time in seconds executing
elapsed  = elapsed time in seconds executing
disk     = number of physical reads of buffers from disk
query    = number of buffers gotten for consistent read
current  = number of buffers gotten in current mode (usually for update)
rows     = number of rows processed by the fetch or execute call
********************************************************************************


select /*+ leading(t3) use_merge(t4) */ *
from t3, t4
where t3.id = t4.t3_id and t3.n = 1100


call     count       cpu    elapsed       disk      query    current        rows
------- ------  -------- ---------- ---------- ---------- ----------  ----------
Parse        1      0.00       0.00          0          0          0           0
Execute      1      0.00       0.00          0          0          0           0
Fetch        2      0.00       0.00          0        119          0          10
------- ------  -------- ---------- ---------- ---------- ----------  ----------
total        4      0.00       0.00          0        119          0          10


Misses in library cache during parse: 1
Optimizer mode: ALL_ROWS
Parsing user id: SYS


Rows     Row Source Operation
-------  ---------------------------------------------------
     10  MERGE JOIN  (cr=119 pr=0 pw=0 time=0 us cost=193 size=1280 card=10)
      1   SORT JOIN (cr=15 pr=0 pw=0 time=0 us cost=6 size=63 card=1)
      1    TABLE ACCESS FULL T3 (cr=15 pr=0 pw=0 time=0 us cost=5 size=63 card=1)
     10   SORT JOIN (cr=104 pr=0 pw=0 time=0 us cost=187 size=650000 card=10000)
  10000    TABLE ACCESS FULL T4 (cr=104 pr=0 pw=0 time=8733 us cost=29 size=650000 card=10000)


Elapsed times include waiting on following events:
  Event waited on                             Times   Max. Wait  Total Waited
  ----------------------------------------   Waited  ----------  ------------
  SQL*Net message to client                       2        0.00          0.00
  SQL*Net message from client                     2       20.23         20.23


********************************************************************************


OVERALL TOTALS FOR ALL NON-RECURSIVE STATEMENTS


call     count       cpu    elapsed       disk      query    current        rows
------- ------  -------- ---------- ---------- ---------- ----------  ----------
Parse        1      0.00       0.00          0          0          0           0
Execute      1      0.00       0.00          0          0          0           0
Fetch        2      0.00       0.00          0        119          0          10
------- ------  -------- ---------- ---------- ---------- ----------  ----------
total        4      0.00       0.00          0        119          0          10


Misses in library cache during parse: 1


Elapsed times include waiting on following events:
  Event waited on                             Times   Max. Wait  Total Waited
  ----------------------------------------   Waited  ----------  ------------
  SQL*Net message to client                       3        0.00          0.00
  SQL*Net message from client                     3       20.23         30.20


OVERALL TOTALS FOR ALL RECURSIVE STATEMENTS


call     count       cpu    elapsed       disk      query    current        rows
------- ------  -------- ---------- ---------- ---------- ----------  ----------
Parse        0      0.00       0.00          0          0          0           0
Execute      0      0.00       0.00          0          0          0           0
Fetch        0      0.00       0.00          0          0          0           0
------- ------  -------- ---------- ---------- ---------- ----------  ----------
total        0      0.00       0.00          0          0          0           0


Misses in library cache during parse: 0


    1  user  SQL statements in session.
    0  internal SQL statements in session.
    1  SQL statements in session.
********************************************************************************
Trace file: g:\app\davidd\diag\rdbms\david\david\trace\david_ora_2176.trc
Trace file compatibility: 11.1.0.7
Sort options: default


       1  session in tracefile.
       1  user  SQL statements in trace file.
       0  internal SQL statements in trace file.
       1  SQL statements in trace file.
       1  unique SQL statements in trace file.
     122  lines in trace file.
0 elapsed seconds in trace file.其中,Misses in library cache during parse :1 意思是解析的时候库缓存丢失游标, 也就是说发生了一次硬解析

Hot AI Tools

Undresser.AI Undress
AI-powered app for creating realistic nude photos

AI Clothes Remover
Online AI tool for removing clothes from photos.

Undress AI Tool
Undress images for free

Clothoff.io
AI clothes remover

AI Hentai Generator
Generate AI Hentai for free.

Hot Article
Hot Tools

Notepad++7.3.1
Easy-to-use and free code editor

SublimeText3 Chinese version
Chinese version, very easy to use

Zend Studio 13.0.1
Powerful PHP integrated development environment

Dreamweaver CS6
Visual web development tools

SublimeText3 Mac version
God-level code editing software (SublimeText3)
Hot Topics
 1377
1377
 52
52

 What to do if the 0x80004005 error code appears. The editor will teach you how to solve the 0x80004005 error code.
Mar 21, 2024 pm 09:17 PM
What to do if the 0x80004005 error code appears. The editor will teach you how to solve the 0x80004005 error code.
Mar 21, 2024 pm 09:17 PM
When deleting or decompressing a folder on your computer, sometimes a prompt dialog box "Error 0x80004005: Unspecified Error" will pop up. How should you solve this situation? There are actually many reasons why the error code 0x80004005 is prompted, but most of them are caused by viruses. We can re-register the dll to solve the problem. Below, the editor will explain to you the experience of handling the 0x80004005 error code. Some users are prompted with error code 0X80004005 when using their computers. The 0x80004005 error is mainly caused by the computer not correctly registering certain dynamic link library files, or by a firewall that does not allow HTTPS connections between the computer and the Internet. So how about
 Check out the steps to delete a logged-in device on Douyin
Mar 26, 2024 am 09:01 AM
Check out the steps to delete a logged-in device on Douyin
Mar 26, 2024 am 09:01 AM
1. First, click to open the Douyin app and click [Me]. 2. Click the three-dot icon in the upper right corner. 3. Click to enter [Settings]. 4. Click to open [Account and Security]. 5. Select and click [Log in to device management]. 6. Finally, click to select the device and click [Remove].
 How to use NetEase Mailbox Master
Mar 27, 2024 pm 05:32 PM
How to use NetEase Mailbox Master
Mar 27, 2024 pm 05:32 PM
NetEase Mailbox, as an email address widely used by Chinese netizens, has always won the trust of users with its stable and efficient services. NetEase Mailbox Master is an email software specially created for mobile phone users. It greatly simplifies the process of sending and receiving emails and makes our email processing more convenient. So how to use NetEase Mailbox Master, and what specific functions it has. Below, the editor of this site will give you a detailed introduction, hoping to help you! First, you can search and download the NetEase Mailbox Master app in the mobile app store. Search for "NetEase Mailbox Master" in App Store or Baidu Mobile Assistant, and then follow the prompts to install it. After the download and installation is completed, we open the NetEase email account and log in. The login interface is as shown below
 How to use Baidu Netdisk app
Mar 27, 2024 pm 06:46 PM
How to use Baidu Netdisk app
Mar 27, 2024 pm 06:46 PM
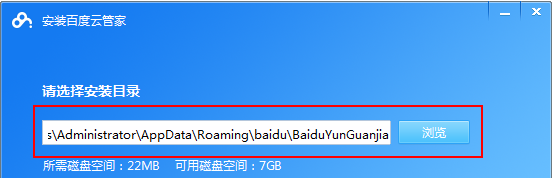
Cloud storage has become an indispensable part of our daily life and work nowadays. As one of the leading cloud storage services in China, Baidu Netdisk has won the favor of a large number of users with its powerful storage functions, efficient transmission speed and convenient operation experience. And whether you want to back up important files, share information, watch videos online, or listen to music, Baidu Cloud Disk can meet your needs. However, many users may not understand the specific use method of Baidu Netdisk app, so this tutorial will introduce in detail how to use Baidu Netdisk app. Users who are still confused can follow this article to learn more. ! How to use Baidu Cloud Network Disk: 1. Installation First, when downloading and installing Baidu Cloud software, please select the custom installation option.
 BTCC tutorial: How to bind and use MetaMask wallet on BTCC exchange?
Apr 26, 2024 am 09:40 AM
BTCC tutorial: How to bind and use MetaMask wallet on BTCC exchange?
Apr 26, 2024 am 09:40 AM
MetaMask (also called Little Fox Wallet in Chinese) is a free and well-received encryption wallet software. Currently, BTCC supports binding to the MetaMask wallet. After binding, you can use the MetaMask wallet to quickly log in, store value, buy coins, etc., and you can also get 20 USDT trial bonus for the first time binding. In the BTCCMetaMask wallet tutorial, we will introduce in detail how to register and use MetaMask, and how to bind and use the Little Fox wallet in BTCC. What is MetaMask wallet? With over 30 million users, MetaMask Little Fox Wallet is one of the most popular cryptocurrency wallets today. It is free to use and can be installed on the network as an extension
 How to check your own ID on Xianyu_Introduction to how to check your personal nickname on Xianyu
Mar 22, 2024 am 08:21 AM
How to check your own ID on Xianyu_Introduction to how to check your personal nickname on Xianyu
Mar 22, 2024 am 08:21 AM
As a trading platform, Xianyu requires you to register and log in to your account before using it. Users can set an ID name for their account. What if they want to check what their ID is? Let’s find out together below! Introduction to how to view personal nicknames on Xianyu. First, start the Xianyu app. After entering the homepage, switch to the page of selling idle, messages, and me, and click the [My] option in the lower right corner. 2. Then on my page we need to click [Avatar] in the upper left corner; 2. Then when we go to the personal homepage page we can see different information, we need to click the [Edit Information] button here; 4. Finally click We can see it later on the page where we edit information;
 Where to check music rankings on NetEase Cloud Music_How to check music rankings on NetEase Cloud Music
Mar 25, 2024 am 11:40 AM
Where to check music rankings on NetEase Cloud Music_How to check music rankings on NetEase Cloud Music
Mar 25, 2024 am 11:40 AM
1. After turning on the phone, select NetEase Cloud Music. 2. After entering the homepage, you can see the [Ranking List] and click to enter. 3. In the ranking list, you can select any list and click [New Song List]. 4. Select your favorite song and click on it. 5. Return to the previous page to see more lists.
 How to view the hot list of Kuaishou Live Companion videos
Mar 29, 2024 pm 08:09 PM
How to view the hot list of Kuaishou Live Companion videos
Mar 29, 2024 pm 08:09 PM
Kuaishou Live Companion is not only a powerful live broadcast auxiliary tool, but also a real-time insight platform for hot topics and trends created for broadcasters. Through this function, anchors can quickly capture the content that audiences are most concerned about, and then adjust the live content to make it more in line with the audience's tastes and interests. So how to check the hot video list in the Kuaishou Live Companion app? This tutorial guide will provide you with a detailed introduction to the steps. I hope it can help you. How to view the hot video list on Kuaishou Live Companion? The second step is to click on the daily video hot list. The third step is to check the daily video hot list.
