在Linux下使用Python的matplotlib绘制数据图的教程
如果你想要在Linxu中获得一个高效、自动化、高质量的科学画图的解决方案,应该考虑尝试下matplotlib库。Matplotlib是基于python的开源科学测绘包,基于python软件基金会许可证发布。大量的文档和例子、集成了Python和Numpy科学计算包、以及自动化能力,是作为Linux环境中进行科学画图的可靠选择的几个原因。这个教程将提供几个用matplotlib画图的例子。
特性
- 支持众多的图表类型,如:bar,box,contour,histogram,scatter,line plots....
- 基于python的语法
- 集成Numpy科学计算包
- 数据源可以是 python 的列表、键值对和数组
- 可定制的图表格式(坐标轴缩放、标签位置及标签内容等)
- 可定制文本(字体,大小,位置...)
- 支持TeX格式(等式,符号,希腊字体...)
- 与IPython相兼容(允许在 python shell 中与图表交互)
- 自动化(使用 Python 循环创建图表)
- 用Python 的循环迭代生成图片
- 保存所绘图片格式为图片文件,如:png,pdf,ps,eps,svg等
基于Python语法的matplotlib是其许多特性和高效工作流的基础。世面上有许多用于绘制高质量图的科学绘图包,但是这些包允许你直接在你的Python代码中去使用吗?除此以外,这些包允许你创建可以保存为图片文件的图片吗?Matplotlib允许你完成所有的这些任务。从而你可以节省时间,使用它你能够花更少的时间创建更多的图片。
安装
安装Python和Numpy包是使用Matplotlib的前提。
可以通过如下命令在Debian或Ubuntu中安装Matplotlib:
$ sudo apt-get install python-matplotlib
在Fedora或CentOS/RHEL环境则可用如下命令:
$ sudo yum install python-matplotlib
Matplotlib 例子
本教程会提供几个绘图例子演示如何使用matplotlib:
- 离散图和线性图
- 柱状图
- 饼状图
在这些例子中我们将用Python脚本来执行Mapplotlib命令。注意numpy和matplotlib模块需要通过import命令在脚本中进行导入。
np为nuupy模块的命名空间引用,plt为matplotlib.pyplot的命名空间引用:
  import numpy as np
  import matplotlib.pyplot as plt
例1:离散和线性图
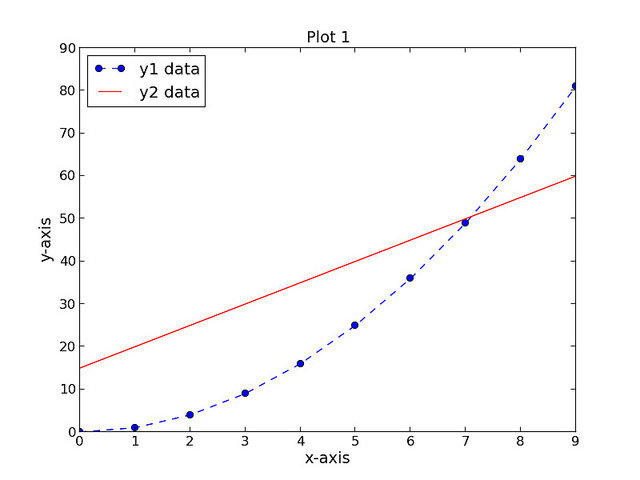
第一个脚本,script1.py 完成如下任务:
- 创建3个数据集(xData,yData1和yData2)
- 创建一个宽8英寸、高6英寸的图(赋值1)
- 设置图画的标题、x轴标签、y轴标签(字号均为14)
- 绘制第一个数据集:yData1为xData数据集的函数,用圆点标识的离散蓝线,标识为"y1 data"
- 绘制第二个数据集:yData2为xData数据集的函数,采用红实线,标识为"y2 data"
- 把图例放置在图的左上角
- 保存图片为PNG格式文件
script1.py的内容如下:
 import numpy as np
  import matplotlib.pyplot as plt

  xData = np.arange(0, 10, 1)
  yData1 = xData.__pow__(2.0)
  yData2 = np.arange(15, 61, 5)
  plt.figure(num=1, figsize=(8, 6))
  plt.title('Plot 1', size=14)
  plt.xlabel('x-axis', size=14)
  plt.ylabel('y-axis', size=14)
  plt.plot(xData, yData1, color='b', linestyle='--', marker='o', label='y1 data')
  plt.plot(xData, yData2, color='r', linestyle='-', label='y2 data')
  plt.legend(loc='upper left')
  plt.savefig('images/plot1.png', format='png')
所画之图如下:

例2:柱状图
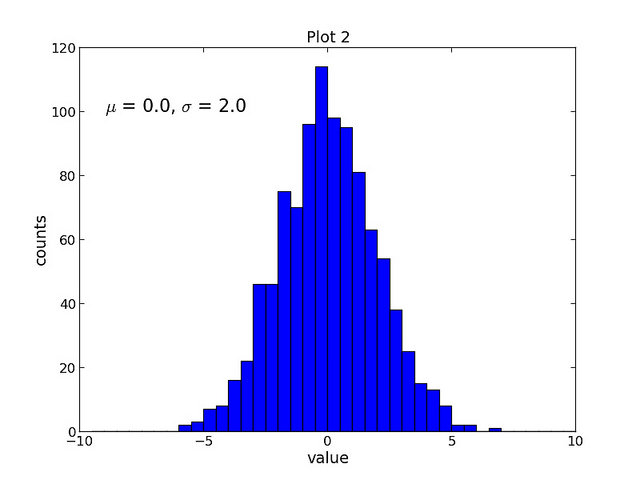
第二个脚本,script2.py 完成如下任务:
- 创建一个包含1000个随机样本的正态分布数据集。
- 创建一个宽8英寸、高6英寸的图(赋值1)
- 设置图的标题、x轴标签、y轴标签(字号均为14)
- 用samples这个数据集画一个40个柱状,边从-10到10的柱状图
- 添加文本,用TeX格式显示希腊字母mu和sigma(字号为16)
- 保存图片为PNG格式。
script2.py代码如下:
  import numpy as np
  import matplotlib.pyplot as plt

  mu = 0.0
  sigma = 2.0
  samples = np.random.normal(loc=mu, scale=sigma, size=1000)
  plt.figure(num=1, figsize=(8, 6))
  plt.title('Plot 2', size=14)
  plt.xlabel('value', size=14)
  plt.ylabel('counts', size=14)
  plt.hist(samples, bins=40, range=(-10, 10))
  plt.text(-9, 100, r'$\mu$ = 0.0, $\sigma$ = 2.0', size=16)
  plt.savefig('images/plot2.png', format='png')
结果见如下链接:

例3:饼状图
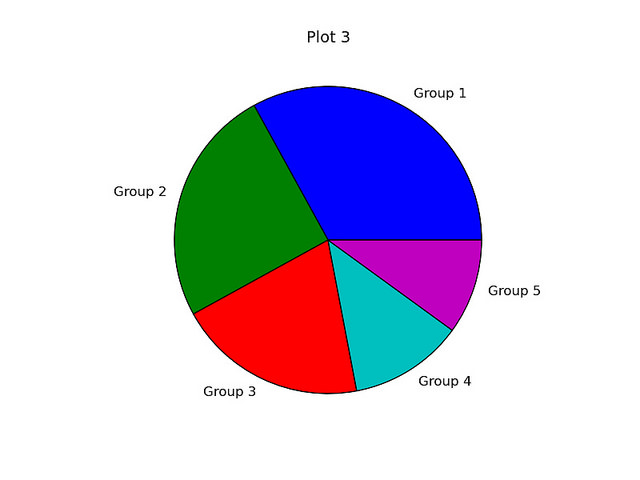
第三个脚本,script3.py 完成如下任务:
- 创建一个包含5个整数的列表
- 创建一个宽6英寸、高6英寸的图(赋值1)
- 添加一个长宽比为1的轴图
- 设置图的标题(字号为14)
- 用data列表画一个包含标签的饼状图
- 保存图为PNG格式
脚本script3.py的代码如下:
  import numpy as np
  import matplotlib.pyplot as plt

  data = [33, 25, 20, 12, 10]
  plt.figure(num=1, figsize=(6, 6))
  plt.axes(aspect=1)
  plt.title('Plot 3', size=14)
  plt.pie(data, labels=('Group 1', 'Group 2', 'Group 3', 'Group 4', 'Group 5'))
  plt.savefig('images/plot3.png', format='png')
结果如下链接所示:

总结
这个教程提供了几个用matplotlib科学画图包进行画图的例子,Matplotlib是在Linux环境中用于解决科学画图的绝佳方案,表现在其无缝地和Python、Numpy连接、自动化能力,和提供多种自定义的高质量的画图产品。

Hot AI Tools

Undresser.AI Undress
AI-powered app for creating realistic nude photos

AI Clothes Remover
Online AI tool for removing clothes from photos.

Undress AI Tool
Undress images for free

Clothoff.io
AI clothes remover

AI Hentai Generator
Generate AI Hentai for free.

Hot Article

Hot Tools

Notepad++7.3.1
Easy-to-use and free code editor

SublimeText3 Chinese version
Chinese version, very easy to use

Zend Studio 13.0.1
Powerful PHP integrated development environment

Dreamweaver CS6
Visual web development tools

SublimeText3 Mac version
God-level code editing software (SublimeText3)

Hot Topics
 Is the conversion speed fast when converting XML to PDF on mobile phone?
Apr 02, 2025 pm 10:09 PM
The speed of mobile XML to PDF depends on the following factors: the complexity of XML structure. Mobile hardware configuration conversion method (library, algorithm) code quality optimization methods (select efficient libraries, optimize algorithms, cache data, and utilize multi-threading). Overall, there is no absolute answer and it needs to be optimized according to the specific situation.
 How to convert XML files to PDF on your phone?
Apr 02, 2025 pm 10:12 PM
It is impossible to complete XML to PDF conversion directly on your phone with a single application. It is necessary to use cloud services, which can be achieved through two steps: 1. Convert XML to PDF in the cloud, 2. Access or download the converted PDF file on the mobile phone.
 What is the function of C language sum?
Apr 03, 2025 pm 02:21 PM
There is no built-in sum function in C language, so it needs to be written by yourself. Sum can be achieved by traversing the array and accumulating elements: Loop version: Sum is calculated using for loop and array length. Pointer version: Use pointers to point to array elements, and efficient summing is achieved through self-increment pointers. Dynamically allocate array version: Dynamically allocate arrays and manage memory yourself, ensuring that allocated memory is freed to prevent memory leaks.
 Is there any mobile app that can convert XML into PDF?
Apr 02, 2025 pm 08:54 PM
An application that converts XML directly to PDF cannot be found because they are two fundamentally different formats. XML is used to store data, while PDF is used to display documents. To complete the transformation, you can use programming languages and libraries such as Python and ReportLab to parse XML data and generate PDF documents.
 How to convert xml into pictures
Apr 03, 2025 am 07:39 AM
XML can be converted to images by using an XSLT converter or image library. XSLT Converter: Use an XSLT processor and stylesheet to convert XML to images. Image Library: Use libraries such as PIL or ImageMagick to create images from XML data, such as drawing shapes and text.
 Recommended XML formatting tool
Apr 02, 2025 pm 09:03 PM
XML formatting tools can type code according to rules to improve readability and understanding. When selecting a tool, pay attention to customization capabilities, handling of special circumstances, performance and ease of use. Commonly used tool types include online tools, IDE plug-ins, and command-line tools.
 What is the process of converting XML into images?
Apr 02, 2025 pm 08:24 PM
To convert XML images, you need to determine the XML data structure first, then select a suitable graphical library (such as Python's matplotlib) and method, select a visualization strategy based on the data structure, consider the data volume and image format, perform batch processing or use efficient libraries, and finally save it as PNG, JPEG, or SVG according to the needs.
 Is there a mobile app that can convert XML into PDF?
Apr 02, 2025 pm 09:45 PM
There is no APP that can convert all XML files into PDFs because the XML structure is flexible and diverse. The core of XML to PDF is to convert the data structure into a page layout, which requires parsing XML and generating PDF. Common methods include parsing XML using Python libraries such as ElementTree and generating PDFs using ReportLab library. For complex XML, it may be necessary to use XSLT transformation structures. When optimizing performance, consider using multithreaded or multiprocesses and select the appropriate library.


