
 Web Front-end
JS Tutorial
SVG-based web page graphics drawing API introduction and programming demonstration_javascript skills
Web Front-end
JS Tutorial
SVG-based web page graphics drawing API introduction and programming demonstration_javascript skills
SVG-based web page graphics drawing API introduction and programming demonstration_javascript skills

SVG is a 2D graphics description language released by W3C in 1999. It is a markup language purely based on XML format. The full name of SVG
is scalable vector graphics and traditional Raster There is a big difference
in the format of graphics (JPG, PNG, GIF, etc.). SVG is a 2D graphics development platform, including two parts, one is data description based on XML language, and the other part is a programmable API. Its key features support graphics, text, gradient fill, brush style, graphics
Special effect filters such as Gaussian blur will be demonstrated in the code later. It also supports various mouse events and DOM part
API. Almost all mainstream browsers support the rendering and rendering of SVG graphics format. IE9 and above also begin to
support SVG. In lower versions of IE, plug-in support is required.
To learn more about SVG, visit here: http://www.w3.org/Graphics/SVG/About.html
Two: SVG API programming demonstration in JavaScript Create and obtain SVG object
var mySvg = document.createElementNS("http://www.w3.org/2000/svg","svg");
mySvg.setAttribute("version","1.2");// IE9 support SVG 1.1 version
mySvg.setAttribute("baseProfile","tiny");
container.appendChild(mySvg);
c1.setAttribute("x","20");
c1.setAttribute("y","20");
c1.setAttribute( "width","150");
c1.setAttribute("height","150");
c1.setAttribute("fill","rgb(0,0,255)");
c1 .setAttribute("stroke","rgb(0,0,0)");
c1.setAttribute("stroke-width","4");
mySvg.appendChild(c1);
var stext = document.createElementNS("http://www.w3.org/2000/svg","text");
stext.setAttribute("x","700 ");
stext.setAttribute("y","100");
stext.setAttribute("font-size","18px");
stext.setAttribute("fill","# FF0000");
var textString = document.createTextNode("Hello SVG");
stext.appendChild(textString);
mySvg.appendChild(stext);
c1.addEventListener("click",changeColor,false);
c2.addEventListener("mouseup", changeColor,false);

 Source code, you can copy and run directly
 JavaScript part
window.onload = function() {
// get DIV
var container = document.getElementById("svgContainer");
// create svg object
var mySvg = document.createElementNS("http://www.w3.org/2000/svg", "svg");
mySvg.setAttribute("version", "1.2");// IE9 support SVG 1.1 version
mySvg.setAttribute("baseProfile", "tiny");
container.appendChild(mySvg);
// create svg shape - rectangle
var c1 = document.createElementNS("http://www.w3.org/2000/svg", "rect");
c1.setAttribute("x", "20");
c1.setAttribute("y", "20");
c1.setAttribute("width", "150");
c1.setAttribute("height", "150");
c1.setAttribute("fill", "rgb(0,0,255)");
c1.setAttribute("stroke", "rgb(0,0,0)");
c1.setAttribute("stroke-width", "4");
mySvg.appendChild(c1);
// create svg shape - circle
var c2 = document.createElementNS("http://www.w3.org/2000/svg", "circle");
c2.setAttribute("cx", "250");
c2.setAttribute("cy", "100");
c2.setAttribute("r", "60");
c2.setAttribute("fill", "#996699");
c2.setAttribute("stroke", "#AA99FF");
c2.setAttribute("stroke-width", "7");
mySvg.appendChild(c2);
// create svg shape - ellipse
var c3 = document.createElementNS("http://www.w3.org/2000/svg", "ellipse");
c3.setAttribute("cx", "450");
c3.setAttribute("cy", "100");
c3.setAttribute("rx", "100");
c3.setAttribute("ry", "50");
c3.setAttribute("fill", "#FF0000");
c3.setAttribute("stroke", "purple");
c3.setAttribute("stroke-width", "3");
mySvg.appendChild(c3);
// create svg shape - draw lines
for(var i=0; i<10; i )
{
var sline = document.createElementNS("http://www.w3.org/2000/svg", "line");
var x1 = 580 i*10;
console.log(x1);
sline.setAttribute("x1", x1.toString());
sline.setAttribute("y1", "10");
sline.setAttribute("x2", x1.toString());
sline.setAttribute("y2", "180");
sline.setAttribute("stroke", "rgb(0,255,0)");
sline.setAttribute("stroke-width", "2");
mySvg.appendChild(sline);
}
// SVG draw text
var stext = document.createElementNS("http://www.w3.org/2000/svg", "text");
stext.setAttribute("x", "700");
stext.setAttribute("y", "100");
stext.setAttribute("font-size", "18px");
stext.setAttribute("fill", "#FF0000");
var textString = document.createTextNode("Hello SVG");
stext.appendChild(textString);
mySvg.appendChild(stext);
// mouse event handling
c1.addEventListener("click", changeColor, false);
c2.addEventListener("mouseup", changeColor, false);
};
function changeColor(evt) {
var target = evt.target;
target.setAttributeNS(null, "fill", "green");
}
HTML部分:

Hot AI Tools

Undresser.AI Undress
AI-powered app for creating realistic nude photos

AI Clothes Remover
Online AI tool for removing clothes from photos.

Undress AI Tool
Undress images for free

Clothoff.io
AI clothes remover

AI Hentai Generator
Generate AI Hentai for free.

Hot Article
Hot Tools

Notepad++7.3.1
Easy-to-use and free code editor

SublimeText3 Chinese version
Chinese version, very easy to use

Zend Studio 13.0.1
Powerful PHP integrated development environment

Dreamweaver CS6
Visual web development tools

SublimeText3 Mac version
God-level code editing software (SublimeText3)
Hot Topics
 1377
1377
 52
52

 Let's talk about how to use SVG to achieve image mosaic effect
Sep 01, 2022 am 11:05 AM
Let's talk about how to use SVG to achieve image mosaic effect
Sep 01, 2022 am 11:05 AM
How to use SVG to achieve image mosaic effect without using Javascript? The following article will give you a detailed understanding, I hope it will be helpful to you!
 How to convert svg to jpg format
Nov 24, 2023 am 09:50 AM
How to convert svg to jpg format
Nov 24, 2023 am 09:50 AM
svg can be converted to jpg format by using image processing software, using online conversion tools, and using the Python image processing library. Detailed introduction: 1. Image processing software includes Adobe Illustrator, Inkscape and GIMP; 2. Online conversion tools include CloudConvert, Zamzar, Online Convert, etc.; 3. Python image processing library, etc.
 An in-depth analysis of how to use svg icons in vue3+vite
Apr 28, 2022 am 10:48 AM
An in-depth analysis of how to use svg icons in vue3+vite
Apr 28, 2022 am 10:48 AM
svg images are widely used in projects. The following article will introduce how to use svg icons in vue3 + vite. I hope it will be helpful to everyone!
 VUE3 introductory tutorial: Use Vue.js plug-in to play with SVG
Jun 16, 2023 am 09:48 AM
VUE3 introductory tutorial: Use Vue.js plug-in to play with SVG
Jun 16, 2023 am 09:48 AM
With the continuous development of modern Web front-end development, more and more technologies are widely used in actual development. Among them, Vue.js is currently one of the most popular JavaScript frameworks. It is based on the MVVM model and provides a rich API and component library, making it easier to develop responsive, reusable, and efficient web applications. The latest version of Vue.js3 has better performance and richer features than the old version, which has attracted widespread attention and research. This article will introduce to you a
 Graphic drawing tool - matplotlib installation tutorial
Jan 09, 2024 pm 05:22 PM
Graphic drawing tool - matplotlib installation tutorial
Jan 09, 2024 pm 05:22 PM
Graphic drawing tool - matplotlib installation tutorial 1. Introduction matplotlib is a powerful Python drawing library used to generate various types of graphics, including line charts, scatter plots, bar charts, pie charts, etc. Its installation is very simple and convenient. This article will introduce how to install matplotlib and give specific code examples. 2. Install matplotlib and install Python. First, make sure that Python is installed on your computer. You can find it on the Python official website (
 Detailed explanation of using SVG to add logo to favicon
Sep 07, 2022 am 10:30 AM
Detailed explanation of using SVG to add logo to favicon
Sep 07, 2022 am 10:30 AM
How to add logo to favicon using SVG? The following article will introduce to you how to use SVG to generate favicon with logo. I hope it will be helpful to you!
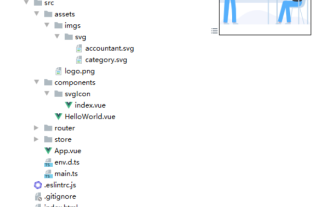 How to use svg method in vue3+vite2
May 11, 2023 pm 05:55 PM
How to use svg method in vue3+vite2
May 11, 2023 pm 05:55 PM
1. Install vite-plugin-svg-icons. You also need to install fast-glob related dependencies. Otherwise, when vite runs npmrundev, it will report the Cannotfindmodule'fast-glob' error npmifast-glob@3.x-Dnpmivite-plugin-svg. -icons@2.x-D 2. Create a new component index.vueimport{computed}from'vue';cons under src/components/svgIcon
 How to use svg in vue3+vue-cli4
May 11, 2023 pm 05:58 PM
How to use svg in vue3+vue-cli4
May 11, 2023 pm 05:58 PM
1. Install svg-sprite-loadernpminstallsvg-sprite-loader--save-dev 2. Create a new component under src/components/svgIcon index.vueimport{computed}from"@vue/reactivity";exportdefault{name:"baseSvgIcon", props:{iconClass:{type:String},className:{type:String},},setup
