Sublime Text is an excellent cross-platform editor with a beautiful user interface and powerful features, such as code thumbnails, multiple selections, shortcut commands, etc. Key bindings, menus and toolbars can also be customized. The main features of Sublime Text include: spell check, bookmarks, complete Python API, Goto function, instant project switching, multi-selection, multi-window and more.
In addition, Sublime Text has many plug-ins, which can be easily installed and managed through package management tools. The Sublime Web Inspector introduced in this article is an excellent development assistance plug-in among many plug-ins, which can help web developers debug JavaScript code directly in Sublime Text.
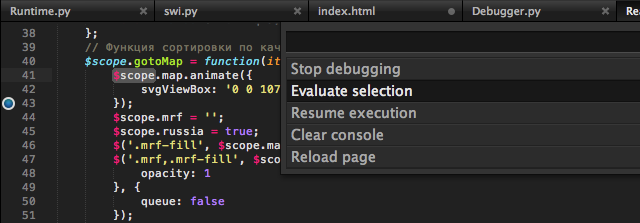
The main features of Sublime Web Inspector are as follows: BreakpointIn the editor, you can set and delete breakpoints.

View all console messages sorted by level.

Click the name:line area to navigate to the file and line of code; click Object to plug in the properties of the object.

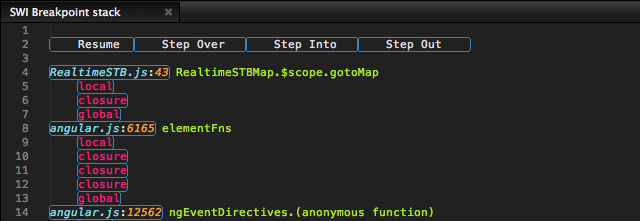
At the breakpoint, you can see the stack of the code running and all variables (local, global, closure).

Add monitoring functionality similar to Firebug.

 Sublime input Chinese method
 How to turn off sublime auto-completion
 How to install third-party libraries in sublime
 sublime runs js code
 How to check the video memory of Win11
 ajax tutorial
 How to export word from powerdesigner
 How to insert video in html
 Introduction to screenshot shortcut keys in win10


