 Software Tutorial
 Computer Software
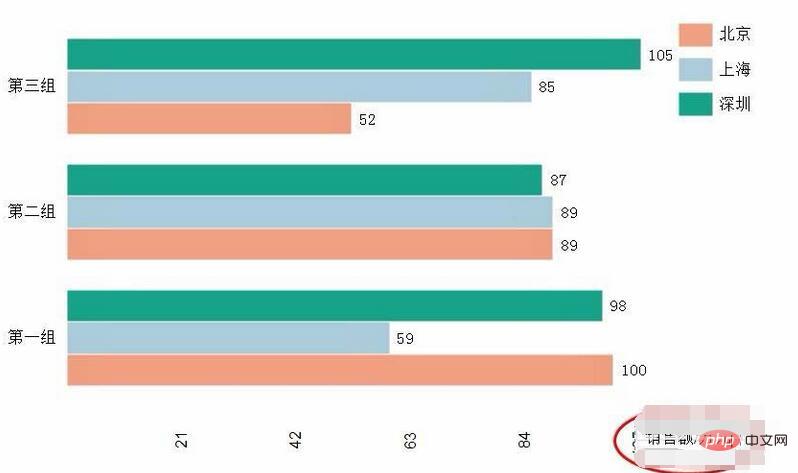
 Edraw flow chart making software operation process for designing color bar charts
Edraw flow chart making software operation process for designing color bar charts
Have questions about beautifully designed bar charts? don’t worry! PHP editor Zimo will give you a detailed introduction to the production process of color bar charts in Edraw flowchart production software, guiding you step by step from creating a new document to adding data and customizing the appearance. Read on to master the techniques for creating impressive color bar charts that will improve your data presentation.
Chart/Bar Chart/Double-click to enter the creation page

Select the required bar chart and place it in the appropriate position

Select the symbol of the table, and a table will pop up. Of course, you can also import some external data by loading it

Edit the value, and close the table window directly after editing

Now the bar graph becomes data in the table, and the data can also be modified directly in the graph

Select a category to edit the color

In the properties, you can edit the numerical range and category spacing of the table

Double-click the data or text box to modify the text

Everyone should have learned it after reading the above!
The above is the detailed content of Edraw flow chart making software operation process for designing color bar charts. For more information, please follow other related articles on the PHP Chinese website!

Hot AI Tools

Undresser.AI Undress
AI-powered app for creating realistic nude photos

AI Clothes Remover
Online AI tool for removing clothes from photos.

Undress AI Tool
Undress images for free

Clothoff.io
AI clothes remover

Video Face Swap
Swap faces in any video effortlessly with our completely free AI face swap tool!

Hot Article

Hot Tools

Notepad++7.3.1
Easy-to-use and free code editor

SublimeText3 Chinese version
Chinese version, very easy to use

Zend Studio 13.0.1
Powerful PHP integrated development environment

Dreamweaver CS6
Visual web development tools

SublimeText3 Mac version
God-level code editing software (SublimeText3)

Hot Topics
 1664
1664
 14
14
 1421
1421
 52
52
 1315
1315
 25
25
 1266
1266
 29
29
 1239
1239
 24
24
 How much does Microsoft PowerToys cost?
Apr 09, 2025 am 12:03 AM
Microsoft PowerToys is free. This collection of tools developed by Microsoft is designed to enhance Windows system functions and improve user productivity. By installing and using features such as FancyZones, users can customize window layouts and optimize workflows.


