How to Check RAM, GPU, and CPU Usage in Windows 11
Keeping an eye on system resources can be vital, especially when experiencing glitches or slowdowns. If you're on Windows, there are tools baked into the operating system that let you quickly look up just how much of your RAM, CPU, and GPU are being used by a specific process.
How to Check Windows 11's System Resource Usage With Task Manager
The Task Manager is one of Windows 11’s primary system resource monitoring utilities. The tool is the easiest way to see which programs and processes are running and how many resources each takes up.
Related: How to Access the Task Manager on Windows 11
Here's how you can check your PC’s system resource usage with Task Manager.
- Press CTRL + Shift + Esc to open Task Manager.
- Click the Performance tab. This tab displays your system's RAM, CPU, GPU, and disk usage, along with network info.
- To view RAM usage, select the Memory section. This section will show you how much memory the system is currently using, how much memory you have, and its specifications among other things.

- You can check your computer's processor usage by clicking the CPU section. The processor box shows you a variable CPU percentage utilization figure, current clock speed, base clock speed, system uptime, and more.
- Click the GPU section to see how much GPU memory is in use. You can choose which one you want to see if your PC has two GPUs (as with laptops with one integrated and one dedicated GPU).
Task Manager also has a neat summary view that displays only the system resource usage boxes. To switch to that viewing mode, right-click within Task Manager and select Summary View. Then the Task Manager window will shrink as shown below.
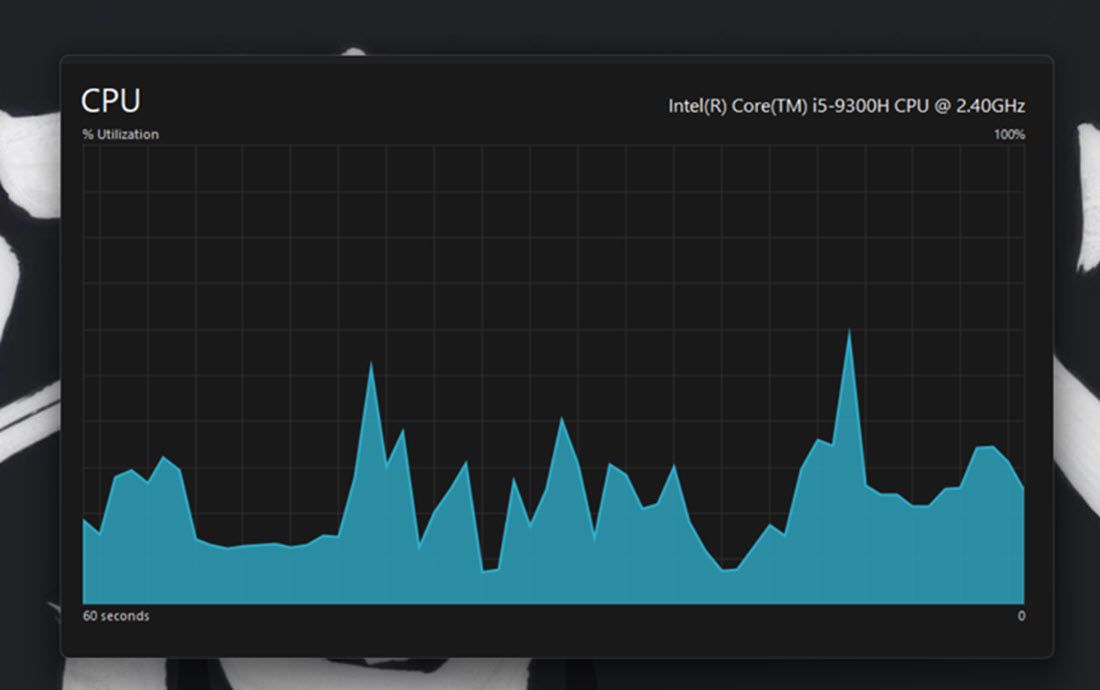
To check which programs consume the most resources, click the Processes tab. This tab displays all running apps and background processes, their memory, CPU, disk, network, and GPU usage. You can also free up system resources by selecting unnecessary third-party background programs (or processes and services) you don’t need and clicking the End task button.

Read also: How to Free Up RAM and Reduce RAM Usage on Windows
How to Check Windows 11's System Resource Usage With the Resource Monitor
The Resource Monitor is a slightly more detailed monitoring utility than Task Manager in Windows 11. It first appeared in Windows Vista and has since been a part of every subsequent Windows release. In addition to CPU, network, disk, and memory usage, the resource monitor also shows real-time metrics such as response time, throughput, and active time among others.
Here's how you can check system resource consumption with Resource Monitor.
- Open the Start menu by pressing the Windows key, type Resource Monitor, and hit enter.
- Select the Memory tab to view its resource usage graphs. That tab includes a physical memory graph that shows how much memory is currently in use, how much is available, and how much is on standby, along with percentage utilization details.
- Click the CPU tab to view its processor utilization percentage graphs.

- Select the Network tab to view processes with network (internet) activity.
- Click Overview to view memory, CPU, network, and disk usage details within a single tab.
How to Check Windows 11's System Resource Usage With the Performance Monitor
The Performance Monitor is the most advanced monitoring tool available in Windows 11. It's designed to help analyze system performance and resource usage while also providing system summaries, performance reports, and real-time performance graphs.
Here is how you can view performance and system resource details with Performance Monitor on Windows 11:
- Open the Start menu by pressing the Windows key, type Performance Monitor, and hit enter.
- Select Performance on the left side of the window to view the system summary resource usage data.

- Click Performance Monitor to view real-time performance data. By default, the graph shows the processor performance counter.

- To add other counters to the graph, click the + Add button.
- Then select a counter, such as Memory, on the window shown directly below. The committed bytes line for the Memory counter highlights the average RAM usage over time.

- Press the Add button.
- Click OK to view performance data for your selected counter on the graph.
You can better analyze this data by creating data collector sets. To do that, select Data Collector sets in Performance Monitor. Right-click User Defined and select New > Data Collector. Then you can set up the new data collector with the wizard that opens.
Information from data collection sets becomes available with reports. You can view information from data collector sets you’ve run by clicking Reports in Performance Manager. Then select User Defined to view your data reports.
Checking System Resources With Third-Party Tools
If the built-in tools in Windows aren't to your liking, there's a plethora of third-party tools that you can use to monitor system resources. You can try out something simple and lightweight such as OpenHardwareMonitor, a free and open-source tool, which shows you CPU, GPU, memory, and disk usage at a glance. It also lets you monitor minimum and maximum temperatures as well as fan speeds for various PC components.
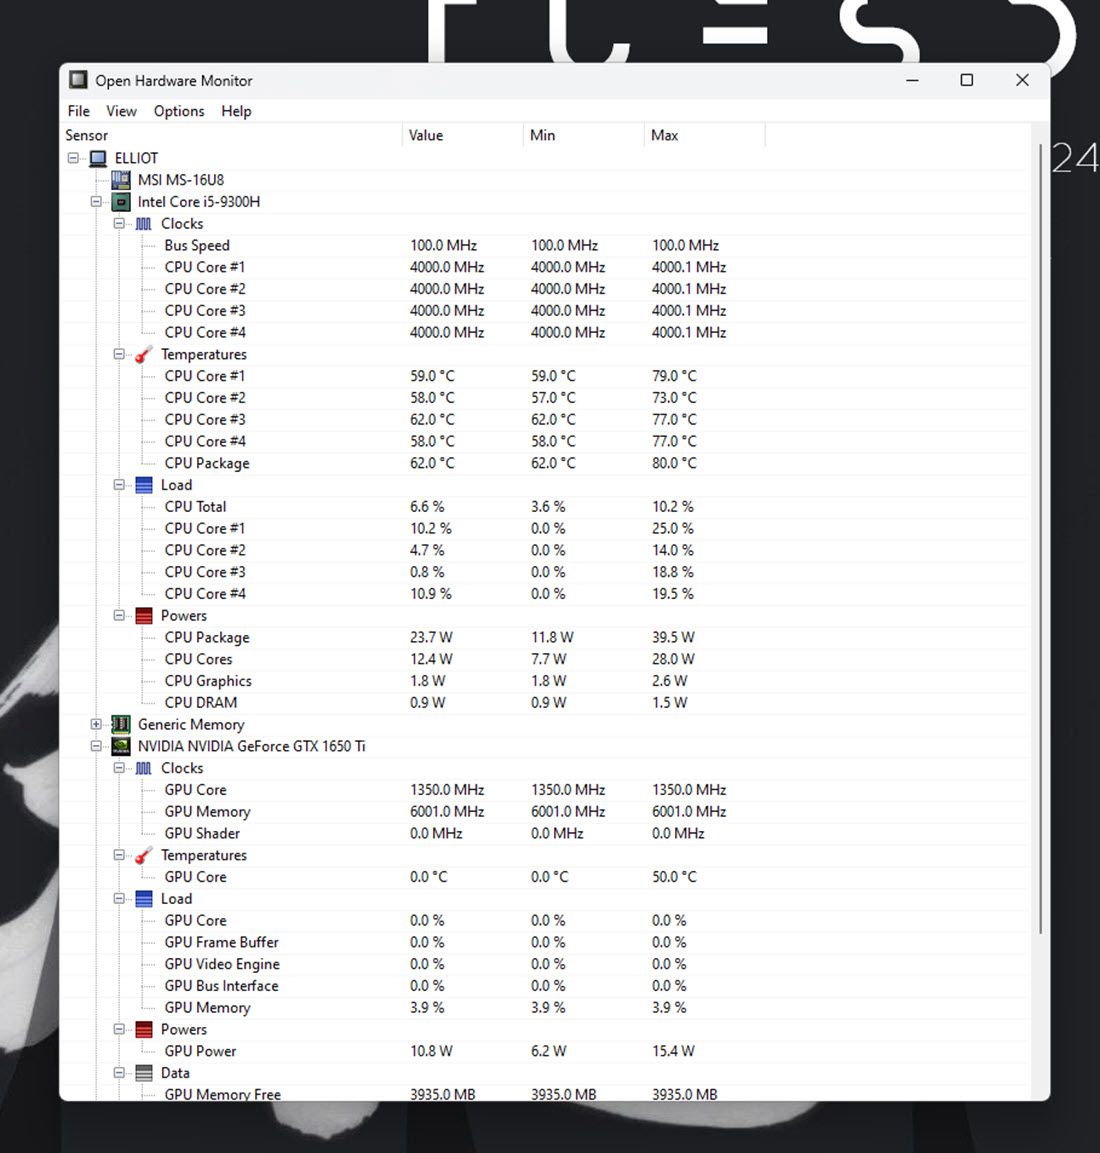
Using the tool is also quite simple, all you have to do is head over to the OpenHardwareMonitor website and download the tool. Once downloaded, simply double-click the executable file to run it and you'll see all the metrics you need.
Alternatives to OpenHardwareMonitor include HWiNFO, Libre Hardware Monitor, and MSI Afterburner, which can also be used for overclocking. That said, while Windows has since discontinued desktop widgets, you can use 8GadgetPack to add system resource monitoring widgets to your desktop. Do keep in mind that the program hasn't been updated in a while though, so there's a chance it might not work as expected.

Windows 11 will become slower and less responsive to your actions when system resource utilization is high (especially for RAM and CPU). Whenever it feels like you need to speed up Windows, check your PC’s resource utilization with the tools and gadgets above.
Once done, you can identify what programs or background processes are hogging the most resources and close them. And once they're close, you’ll notice an improved system performance overall.
The above is the detailed content of How to Check RAM, GPU, and CPU Usage in Windows 11. For more information, please follow other related articles on the PHP Chinese website!

Hot AI Tools

Undresser.AI Undress
AI-powered app for creating realistic nude photos

AI Clothes Remover
Online AI tool for removing clothes from photos.

Undress AI Tool
Undress images for free

Clothoff.io
AI clothes remover

Video Face Swap
Swap faces in any video effortlessly with our completely free AI face swap tool!

Hot Article

Hot Tools

Notepad++7.3.1
Easy-to-use and free code editor

SublimeText3 Chinese version
Chinese version, very easy to use

Zend Studio 13.0.1
Powerful PHP integrated development environment

Dreamweaver CS6
Visual web development tools

SublimeText3 Mac version
God-level code editing software (SublimeText3)

Hot Topics
 Microsoft's New PowerToys Search Is the Missing Feature Windows 11 Needs
Apr 03, 2025 am 03:53 AM
Microsoft's latest PowerToys update introduces a game-changing search feature reminiscent of macOS' Spotlight. This improved "Command Palette" (formerly PowerToys Run) surpasses the functionality of the Windows R Run command and the task
 Windows kb5054979 update information Update content list
Apr 15, 2025 pm 05:36 PM
KB5054979 is a cumulative security update released on March 27, 2025, for Windows 11 version 24H2. It targets .NET Framework versions 3.5 and 4.8.1, enhancing security and overall stability. Notably, the update addresses an issue with file and directory operations on UNC shares using System.IO APIs. Two installation methods are provided: one through Windows Settings by checking for updates under Windows Update, and the other via a manual download from the Microsoft Update Catalog.
 These Are My Go-To Free Alternatives for Paid Windows Apps
Apr 04, 2025 am 03:42 AM
Many free apps rival their paid counterparts in functionality. This list showcases excellent free Windows alternatives to popular paid software. I firmly believe in using free software unless a paid option offers a crucial, missing feature. These
 You Can Get This Powerful Mini PC for Under $150 Today
Apr 02, 2025 am 03:55 AM
Kamrui GK3Plus Mini PC: Small and powerful, affordable! During Amazon's spring sale, the Kamrui GK3Plus Mini PC is priced as low as $150! This mini computer has powerful performance, easy upgrade and small size, making it an ideal choice for users who pursue cost-effectiveness. Whether it’s a mini computer enthusiast or a first-time user who’s trying out a small computer, the Kamrui GK3Plus Mini PC is an excellent starter choice. Originally priced at $199, Amazon currently enjoys a 15% discount (and a $20 coupon) and can be purchased for less than $149. Such a affordable price, but with a good configuration: equipped with a slightly old but competent In
 Microsoft Might Finally Fix Windows 11's Start Menu
Apr 10, 2025 pm 12:07 PM
Windows 11's Start Menu Gets a Much-Needed Overhaul Microsoft's Windows 11 Start menu, initially criticized for its less-than-intuitive app access, is undergoing a significant redesign. Early testing reveals a vastly improved user experience. The up
 Nanoleaf Wants to Change How You Charge Your Tech
Apr 17, 2025 am 01:03 AM
Nanoleaf's Pegboard Desk Dock: A Stylish and Functional Desk Organizer Tired of the same old charging setup? Nanoleaf's new Pegboard Desk Dock offers a stylish and functional alternative. This multifunctional desk accessory boasts 32 full-color RGB
 Dell UltraSharp 4K Thunderbolt Hub Monitor (U2725QE) Review: The Best Looking LCD Monitor I've Tested
Apr 06, 2025 am 02:05 AM
Dell's UltraSharp 4K Thunderbolt Hub Monitor (U2725QE): An LCD That Rivals OLED For years, I've coveted OLED monitors. However, Dell's new UltraSharp 4K Thunderbolt Hub Monitor (U2725QE) has changed my mind, exceeding expectations with its impressiv
 3 Best Ways to Detect and Remove Malware in Windows 11
Apr 02, 2025 pm 06:27 PM
Mastering Malware Detection in Windows 11: Three Easy Methods Malware, encompassing viruses, adware, and data-stealing code, poses a significant threat. With a staggering 190,000 attacks per second, effective malware detection is crucial. This guide


