

Detailed explanation of Elasticsearch's basic friend Logstash

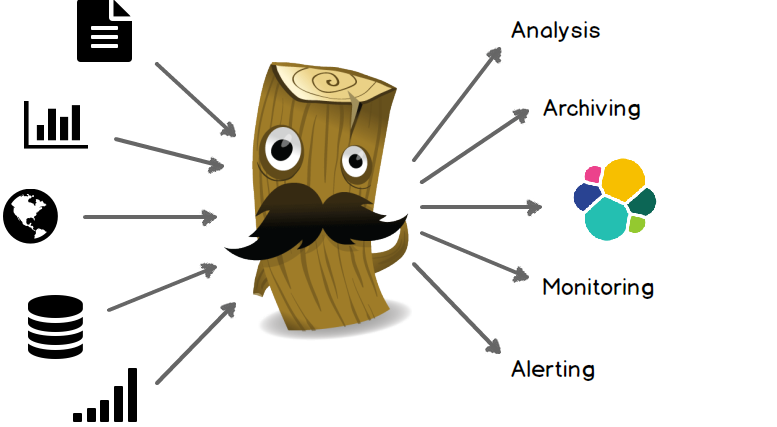
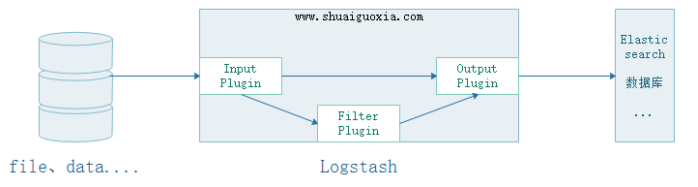
Logstash is a powerful data processing tool that can realize data transmission, format processing, formatted output, and has powerful plug-in functions, which are often used for log processing.
Input
Data can be extracted from files, storage, and databases. Input has two options. One is to hand it over to Filter for filtering and pruning. The other one is given directly to Output
Filter
Ability to dynamically transform and parse data. Data information can be filtered and pruned in a customized way
Output
Providing numerous output options, you can send data where you want it, with the flexibility to unlock numerous downstream use cases.
wget https://artifacts.elastic.co/downloads/logstash/logstash-6.0.1.rpm
yum install -y ./logstash-6.0.1.rpm
vim /etc/logstash/logstash.yml
path.data: /var/lib/logstash                                    # 数据存放路径
path.config: /etc/logstash/conf.d/*.conf                        # 其他插件的配置文件,输入输出过滤等等
path.logs: /var/log/logstash                                    # 日志存放路径
Logstash is a program developed based on Java and needs to run in the JVM. It can be set for the JVM by configuring jvm.options. For example, the maximum and minimum memory, garbage cleaning mechanism, etc. Here are just two of the most commonly used ones.
The memory allocation of JVM cannot be too large or too small. If it is too large, it will slow down the operating system. Too small to start.
vim /etc/logstash/jvm.options                               # logstash有关JVM的配置
-Xms256m                                                    # logstash最大最小使用内存
-Xmx1g
Install an httpd for testing and configure Logstash to collect Apache’s accless.log log file
yum install httpd
echo "Hello world" > /var/www/html/index.html               # 安装httpd,创建首页用于测试
vim /etc/logstash/conf.d/test.conf
input {
    file {                                                  # 使用file作为数据输入
        path => ['/var/log/httpd/access_log']               # 设定读入数据的路径
        start_position => beginning                         # 从文件的开始处读取,end从文件末尾开始读取
    }
}
output {                                                    # 设定输出的位置
    stdout {
        codec => rubydebug                                  # 输出至屏幕
    }
}
Logstash is a built-in command but it is not included in the environment variables, so you can only use the absolute path to use this command.
/usr/share/logstash/bin/logstash -t  -f  /etc/logstash/conf.d/test.conf   # 测试执行配置文件,-t要在-f前面
Configuration OK                                                          # 表示测试OK
After running logstash in the current session, do not close this session. Temporarily call it Session 1, and then open a new window as Session 2
/usr/share/logstash/bin/logstash -f /etc/logstash/conf.d/test.conf
After starting, use the curl command in session 2 to test
curl 172.18.68.14
Then you can see the output information when you return to the previous session 1
{
      "@version" => "1",
          "host" => "logstash.shuaiguoxia.com",
          "path" => "/var/log/httpd/access_log",
    "@timestamp" => 2017-12-10T14:07:07.682Z,
       "message" => "172.18.68.14 - - [10/Dec/2017:22:04:44 +0800] \"GET / HTTP/1.1\" 200 12 \"-\" \"curl/7.29.0\""
}
At this point, the simplest Logstash configuration has been completed. Here, the collected direct output is just collected without filtering or pruning.
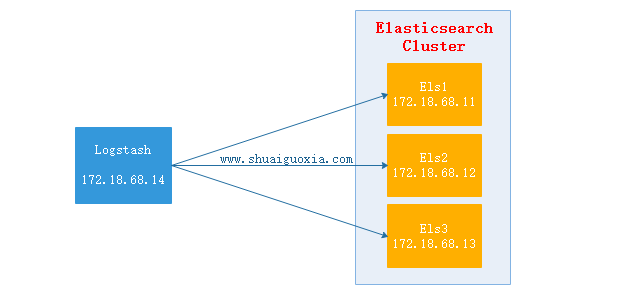
上面的配置时Logsatsh从日志文件中抽取数据,然后输出至屏幕。那么在生产中往往是将抽取的数据过滤后输出到Elasticsearch中。下面讲解Elasticsearch结合Logstash
Logstash抽取httpd的access.log文件,然后经过过滤(结构化)之后输出给Elasticsearch Cluster,在使用Head插件就可以看到抽取到的数据。(Elasticsearch Cluster与Head插件搭建请查看前两篇文章)
配置Logstash
    vim /etc/logstash/conf.d/test.conf
    input {
    file {
        path => ['/var/log/httpd/access_log']
        start_position => "beginning"
    }
    }
    filter {
    grok {
        match => {
            "message" => "%{COMBINEDAPACHELOG}"
        }

        remove_field => "message"
    }
    }
    output {
    elasticsearch {
        hosts => ["http://172.18.68.11:9200","http://172.18.68.12:9200","http://172.18.68.13:9200"]
        index => "logstash-%{+YYYY.MM.dd}"
        action => "index"
        document_type => "apache_logs"
    }
    }
启动Logstash
     /usr/share/logstash/bin/logstash -t -f /etc/logstash/conf.d/test.conf       # 测试配置文件
    Configuration OK
     /usr/share/logstash/bin/logstash  -f /etc/logstash/conf.d/test.conf         # 启动Logstash
测试
每个执行10次172.18.68.14,位Logstash的地址
    curl 127.0.0.1
    curl 172.18.68.14
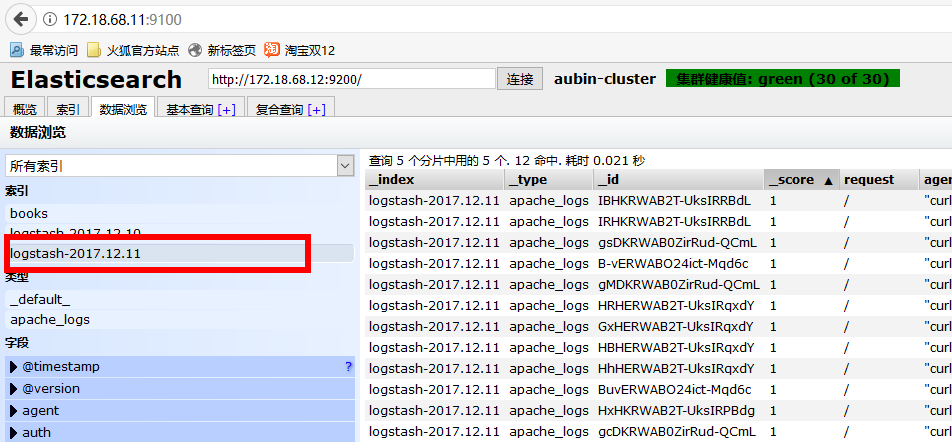
验证数据
使用浏览器访问172.18.68.11:9100(Elastisearch 安装Head地址,前面文章有讲)
选择今天的日期,就能看到一天内访问的所有数据。
监控Nginx日志
仅仅列了filter配置块,input与output参考上一个配置
    filter {
        grok {
                match => {
                        "message" => "%{HTTPD_COMBINEDLOG} \"%{DATA:realclient}\""
                }
                remove_field => "message"
        }
        date {
                match => ["timestamp","dd/MMM/YYYY:H:m:s Z"]
                remove_field => "timestamp"
        }
    }
监控Tomcat
仅仅列了filter配置块,input与output参考上一个配置
    filter {
        grok {
                match => {
                        "message" => "%{HTTPD_COMMONLOG}"
                }
                remove_field => "message"
        }
        date {
                match => ["timestamp","dd/MMM/YYYY:H:m:s Z"]
                remove_field => "timestamp"
        }
    }
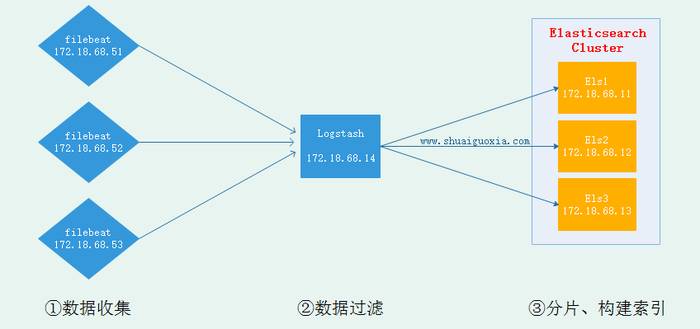
现在已经搭建成在节点安装Logstash并发送到Elasticsearch中去,但是Logstash是基于Java开发需要运行在JVM中,所以是一个重量级采集工具,仅仅对于一个日志采集节点来说使用Logstash太过重量级,那么就可以使用一个轻量级日志收集工具Filebeat来收集日志信息,Filebeat同一交给Logstash进行过滤后再Elasticsearch。这些在接下来的文章在进行讲解,先放一张架构图吧。
The above is the detailed content of Detailed explanation of Elasticsearch's basic friend Logstash. For more information, please follow other related articles on the PHP Chinese website!

Hot AI Tools

Undresser.AI Undress
AI-powered app for creating realistic nude photos

AI Clothes Remover
Online AI tool for removing clothes from photos.

Undress AI Tool
Undress images for free

Clothoff.io
AI clothes remover

Video Face Swap
Swap faces in any video effortlessly with our completely free AI face swap tool!

Hot Article
Hot Tools

Notepad++7.3.1
Easy-to-use and free code editor

SublimeText3 Chinese version
Chinese version, very easy to use

Zend Studio 13.0.1
Powerful PHP integrated development environment

Dreamweaver CS6
Visual web development tools

SublimeText3 Mac version
God-level code editing software (SublimeText3)
Hot Topics


 What computer configuration is required for vscode
Apr 15, 2025 pm 09:48 PM
What computer configuration is required for vscode
Apr 15, 2025 pm 09:48 PM
VS Code system requirements: Operating system: Windows 10 and above, macOS 10.12 and above, Linux distribution processor: minimum 1.6 GHz, recommended 2.0 GHz and above memory: minimum 512 MB, recommended 4 GB and above storage space: minimum 250 MB, recommended 1 GB and above other requirements: stable network connection, Xorg/Wayland (Linux)
 How to run java code in notepad
Apr 16, 2025 pm 07:39 PM
How to run java code in notepad
Apr 16, 2025 pm 07:39 PM
Although Notepad cannot run Java code directly, it can be achieved by using other tools: using the command line compiler (javac) to generate a bytecode file (filename.class). Use the Java interpreter (java) to interpret bytecode, execute the code, and output the result.
 Linux Architecture: Unveiling the 5 Basic Components
Apr 20, 2025 am 12:04 AM
Linux Architecture: Unveiling the 5 Basic Components
Apr 20, 2025 am 12:04 AM
The five basic components of the Linux system are: 1. Kernel, 2. System library, 3. System utilities, 4. Graphical user interface, 5. Applications. The kernel manages hardware resources, the system library provides precompiled functions, system utilities are used for system management, the GUI provides visual interaction, and applications use these components to implement functions.
 vscode cannot install extension
Apr 15, 2025 pm 07:18 PM
vscode cannot install extension
Apr 15, 2025 pm 07:18 PM
The reasons for the installation of VS Code extensions may be: network instability, insufficient permissions, system compatibility issues, VS Code version is too old, antivirus software or firewall interference. By checking network connections, permissions, log files, updating VS Code, disabling security software, and restarting VS Code or computers, you can gradually troubleshoot and resolve issues.
 Can vscode be used for mac
Apr 15, 2025 pm 07:36 PM
Can vscode be used for mac
Apr 15, 2025 pm 07:36 PM
VS Code is available on Mac. It has powerful extensions, Git integration, terminal and debugger, and also offers a wealth of setup options. However, for particularly large projects or highly professional development, VS Code may have performance or functional limitations.
 How to use VSCode
Apr 15, 2025 pm 11:21 PM
How to use VSCode
Apr 15, 2025 pm 11:21 PM
Visual Studio Code (VSCode) is a cross-platform, open source and free code editor developed by Microsoft. It is known for its lightweight, scalability and support for a wide range of programming languages. To install VSCode, please visit the official website to download and run the installer. When using VSCode, you can create new projects, edit code, debug code, navigate projects, expand VSCode, and manage settings. VSCode is available for Windows, macOS, and Linux, supports multiple programming languages and provides various extensions through Marketplace. Its advantages include lightweight, scalability, extensive language support, rich features and version
 How to check the warehouse address of git
Apr 17, 2025 pm 01:54 PM
How to check the warehouse address of git
Apr 17, 2025 pm 01:54 PM
To view the Git repository address, perform the following steps: 1. Open the command line and navigate to the repository directory; 2. Run the "git remote -v" command; 3. View the repository name in the output and its corresponding address.
 What is vscode What is vscode for?
Apr 15, 2025 pm 06:45 PM
What is vscode What is vscode for?
Apr 15, 2025 pm 06:45 PM
VS Code is the full name Visual Studio Code, which is a free and open source cross-platform code editor and development environment developed by Microsoft. It supports a wide range of programming languages and provides syntax highlighting, code automatic completion, code snippets and smart prompts to improve development efficiency. Through a rich extension ecosystem, users can add extensions to specific needs and languages, such as debuggers, code formatting tools, and Git integrations. VS Code also includes an intuitive debugger that helps quickly find and resolve bugs in your code.
