

To display a graph visually, each vertex must be assigned a location. The preceding section introduced how to model a graph using the Graph interface, AbstractGraph class, and UnweightedGraph class. This section discusses how to display graphs graphically. In order to display a graph, you need to know where each vertex is displayed and the name of each vertex. To ensure a graph can be displayed, we define an interface named Displayable that has the methods for obtaining the x- and y-coordinates and their names, and make vertices instances of Displayable, in the code below.

A graph with Displayable vertices can now be displayed on a pane named GraphView, as shown in the code below.

To display a graph on a pane, simply create an instance of GraphView by passing the graph as an argument in the constructor (line 9). The class for the graph’s vertex must implement the Displayable interface in order to display the vertices (lines 13–22). For each vertex index i, invoking graph.getNeighbors(i) returns its adjacency list (line 26). From this list, you can find all vertices that are adjacent to i and draw a line to connect i with its adjacent vertex (lines 27–34).
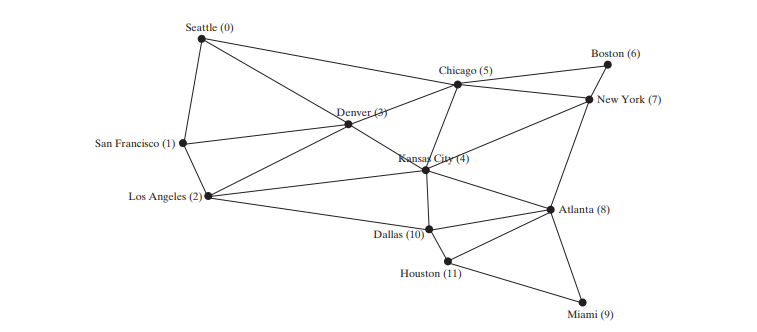
The code below gives an example of displaying the graph in Figure above, as shown in Figure below.

import javafx.application.Application;
import javafx.scene.Scene;
import javafx.stage.Stage;

public class DisplayUSMap extends Application {
    @Override // Override the start method in the Application class
    public void start(Stage primaryStage) {
        City[] vertices = {new City("Seattle", 75, 50),
                new City("San Francisco", 50, 210),
                new City("Los Angeles", 75, 275), new City("Denver", 275, 175),
                new City("Kansas City", 400, 245),
                new City("Chicago", 450, 100), new City("Boston", 700, 80),
                new City("New York", 675, 120), new City("Atlanta", 575, 295),
                new City("Miami", 600, 400), new City("Dallas", 408, 325),
                new City("Houston", 450, 360)};

        // Edge array for graph
        int[][] edges = {
                {0, 1}, {0, 3}, {0, 5}, {1, 0}, {1, 2}, {1, 3},
                {2, 1}, {2, 3}, {2, 4}, {2, 10},
                {3, 0}, {3, 1}, {3, 2}, {3, 4}, {3, 5},
                {4, 2}, {4, 3}, {4, 5}, {4, 7}, {4, 8}, {4, 10},
                {5, 0}, {5, 3}, {5, 4}, {5, 6}, {5, 7},
                {6, 5}, {6, 7}, {7, 4}, {7, 5}, {7, 6}, {7, 8},
                {8, 4}, {8, 7}, {8, 9}, {8, 10}, {8, 11},
                {9, 8}, {9, 11}, {10, 2}, {10, 4}, {10, 8}, {10, 11},
                {11, 8}, {11, 9}, {11, 10}
        };

        Graph<City> graph = new UnweightedGraph<>(vertices, edges);

        // Create a scene and place it in the stage
        Scene scene = new Scene(new GraphView(graph), 750, 450);
        primaryStage.setTitle("DisplayUSMap"); // Set the stage title
        primaryStage.setScene(scene); // Place the scene in the stage
        primaryStage.show(); // Display the stage
    }

    public static void main(String[] args) {
        Application.launch(args);
    }

    static class City implements Displayable {
        private int x, y;
        private String name;

        City(String name, int x, int y) {
            this.name = name;
            this.x = x;
            this.y = y;
        }

        @Override
        public int getX() {
            return x;
        }

        @Override
        public int getY() {
            return y;
        }

        @Override
        public String getName() {
            return name;
        }
    }
}
The class City is defined to model the vertices with their coordinates and names (lines 39–63). The program creates a graph with the vertices of the City type (line 30). Since City implements Displayable, a GraphView object created for the graph displays the graph in the pane (line 33).
The above is the detailed content of Graph Visualization. For more information, please follow other related articles on the PHP Chinese website!


![[Web front-end] Node.js quick start](https://img.php.cn/upload/course/000/000/067/662b5d34ba7c0227.png)


