

Debug Non-Responsive Applications

Read in other languages: English Português 中文
There are many debugger tutorials that teach you how to set line breakpoints, log values, or evaluate expressions. While this knowledge alone gives you many tools to debug your application, real-world scenarios can be a little more complicated and require a more advanced approach.
In this article, we will learn how to locate the code that causes a UI crash without much prior knowledge of the project and fix the broken code on the fly.
The problem
If you want to follow the example, start by cloning this repository: https://github.com/flounder4130/debugger-example
Suppose you have a complex application that crashes when you perform some action. You know how to reproduce the error, but the difficulty is that you don't know which part of the code is responsible for this functionality.

In our example app, the crash occurs when you click the Button N. However, it is not so easy to find the code that is responsible for this action:

Let's see how we can use the debugger to find it.
Method breakpoints
The advantage of method breakpoints over line breakpoints is that they can be used in entire class hierarchies. How is this useful in our case?
If you look at the example project, you will see that all action classes are derived from the Action interface with a single method: perform().

Setting a method breakpoint on this interface method will suspend the application every time one of the derived methods is called. To set a method breakpoint, click the line that declares the method.
Start the debugging session and click the Button N. The application is suspended on ActionImpl14. Now we know where the code corresponding to this button is located.

Although in this article we are focused on finding the bug, this technique can also save you a lot of time when you want to understand how something works in a large codebase.
Pause application
The approach with method breakpoints works well, but it is based on the assumption that we know something about the parent interface. What if this assumption is wrong, or we can't use this approach for some other reason?
Well, we can even do it without breakpoints. Click the Button N, and while the application hangs, go to IntelliJ IDEA. From the main menu, select Run | Debugging Actions | Pause Program.
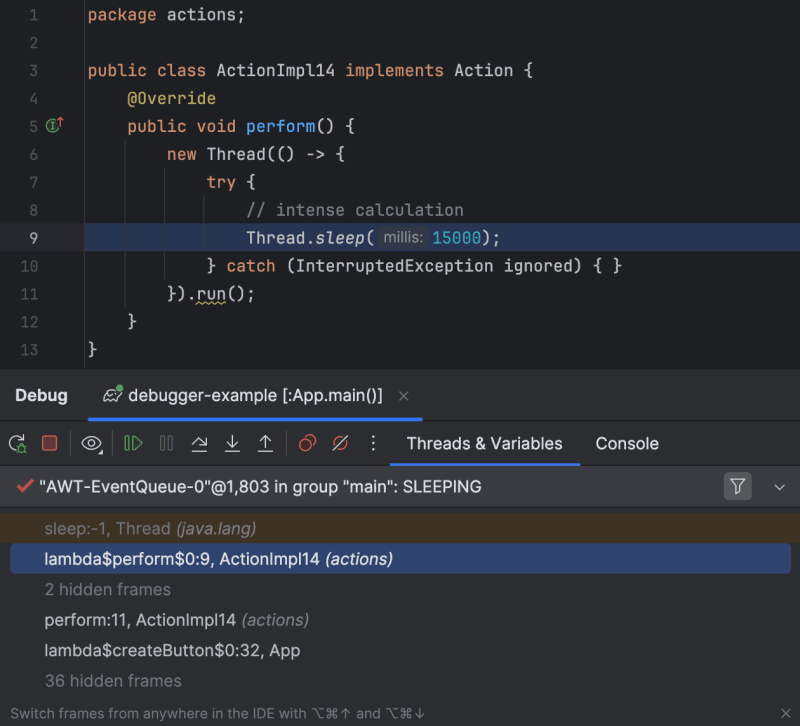
The application will suspend, allowing us to examine the current state of the threads in the Threads & Variables tab. This gives us an idea of what the application is doing at that moment. Since it is hanging, we can identify the method causing the block and trace it back to the call site.
This approach has some advantages over a more traditional thread dump, which we'll cover shortly. For example, it provides you with information about variables in a convenient form and allows you to control further execution of the program.
Tip: For more tips and tricks with Pause Program see Debugging without breakpoints and Debugger.godMode()
Thread Dumps
Finally, we can use a thread dump, which is not strictly a debugger feature. It is available regardless of whether you are using the debugger.
Click the Button N. While the application is crashing, go to IntelliJ IDEA. From the main menu, select Run | Debugging Actions | Get Thread Dump.
Explore the available threads on the left, and in AWT-EventQueue you will see what is causing the problem.

The disadvantage of thread dumps is that they only provide a snapshot of the state of the program at the time they were made. You cannot use thread dumps to explore variables or control program execution.
In our example, we don't need to resort to a thread dump. However, I still wanted to mention this technique as it can be useful in other cases, such as when you are trying to debug an application that has been launched without the debugging agent.
Understand the problem
Regardless of the debugging technique, we arrive at ActionImpl14. In this class, someone intended to do the work in a separate thread, but confused Thread.start() with Thread.run(), which runs code in the same thread as the calling code.
IntelliJ IDEA's static analyzer even warns us about this at design time:

A method that does heavy lifting (or sleeps a lot in this case) is called on the UI thread and blocks it until the method finishes. That's why we can't do anything in the UI for a while after clicking the Button N.
HotSwap
Now that we have discovered the cause of the error, let's correct the problem.
We could stop the program, recompile the code and then run it again. However, it is not always wise to redeploy the entire application just because a small change was made.
Let's do it the smart way. First, fix the code using the suggested quick fix:

After the code is ready, click Run | Debugging Actions | Reload Changed Classes. A balloon appears, confirming that the new code has arrived in the VM.

Let's go back to the app and check. Clicking Button N no longer crashes the app.
Tip: Keep in mind that HotSwap has its limitations. If you are interested in extended HotSwap capabilities, it might be a good idea to take a look at advanced tools like DCEVM or JRebel
Summary
Using our reasoning and a couple of debugger features, we were able to locate the code that was causing a UI crash in our project. We then proceeded to fix the code without wasting time on recompilation and redistribution, which can be lengthy in real-world projects.
I hope you find the techniques described useful. Let me know what you think!
If you are interested in more articles related to debugging and profiling, check out some of my other articles:
- Debugger.godMode() – Hack a JVM Application with the Debugger
- Troubleshoot Slow Debugger
- What's Wrong with createDirectories()? - Guide to CPU Profiling
- Debug without Breakpoints
Stay tuned for more!
The above is the detailed content of Debug Non-Responsive Applications. For more information, please follow other related articles on the PHP Chinese website!

Hot AI Tools

Undresser.AI Undress
AI-powered app for creating realistic nude photos

AI Clothes Remover
Online AI tool for removing clothes from photos.

Undress AI Tool
Undress images for free

Clothoff.io
AI clothes remover

Video Face Swap
Swap faces in any video effortlessly with our completely free AI face swap tool!

Hot Article
Hot Tools

Notepad++7.3.1
Easy-to-use and free code editor

SublimeText3 Chinese version
Chinese version, very easy to use

Zend Studio 13.0.1
Powerful PHP integrated development environment

Dreamweaver CS6
Visual web development tools

SublimeText3 Mac version
God-level code editing software (SublimeText3)
Hot Topics
 1664
1664
 14
1422
52
1316
25
1266
29
1239
24
14
1422
52
1316
25
1266
29
1239
24

 Is the company's security software causing the application to fail to run? How to troubleshoot and solve it?
Apr 19, 2025 pm 04:51 PM
Is the company's security software causing the application to fail to run? How to troubleshoot and solve it?
Apr 19, 2025 pm 04:51 PM
Troubleshooting and solutions to the company's security software that causes some applications to not function properly. Many companies will deploy security software in order to ensure internal network security. ...
 How do I convert names to numbers to implement sorting and maintain consistency in groups?
Apr 19, 2025 pm 11:30 PM
How do I convert names to numbers to implement sorting and maintain consistency in groups?
Apr 19, 2025 pm 11:30 PM
Solutions to convert names to numbers to implement sorting In many application scenarios, users may need to sort in groups, especially in one...
 How to simplify field mapping issues in system docking using MapStruct?
Apr 19, 2025 pm 06:21 PM
How to simplify field mapping issues in system docking using MapStruct?
Apr 19, 2025 pm 06:21 PM
Field mapping processing in system docking often encounters a difficult problem when performing system docking: how to effectively map the interface fields of system A...
 How does IntelliJ IDEA identify the port number of a Spring Boot project without outputting a log?
Apr 19, 2025 pm 11:45 PM
How does IntelliJ IDEA identify the port number of a Spring Boot project without outputting a log?
Apr 19, 2025 pm 11:45 PM
Start Spring using IntelliJIDEAUltimate version...
 How to elegantly obtain entity class variable names to build database query conditions?
Apr 19, 2025 pm 11:42 PM
How to elegantly obtain entity class variable names to build database query conditions?
Apr 19, 2025 pm 11:42 PM
When using MyBatis-Plus or other ORM frameworks for database operations, it is often necessary to construct query conditions based on the attribute name of the entity class. If you manually every time...
 How to safely convert Java objects to arrays?
Apr 19, 2025 pm 11:33 PM
How to safely convert Java objects to arrays?
Apr 19, 2025 pm 11:33 PM
Conversion of Java Objects and Arrays: In-depth discussion of the risks and correct methods of cast type conversion Many Java beginners will encounter the conversion of an object into an array...
 E-commerce platform SKU and SPU database design: How to take into account both user-defined attributes and attributeless products?
Apr 19, 2025 pm 11:27 PM
E-commerce platform SKU and SPU database design: How to take into account both user-defined attributes and attributeless products?
Apr 19, 2025 pm 11:27 PM
Detailed explanation of the design of SKU and SPU tables on e-commerce platforms This article will discuss the database design issues of SKU and SPU in e-commerce platforms, especially how to deal with user-defined sales...
 How to use the Redis cache solution to efficiently realize the requirements of product ranking list?
Apr 19, 2025 pm 11:36 PM
How to use the Redis cache solution to efficiently realize the requirements of product ranking list?
Apr 19, 2025 pm 11:36 PM
How does the Redis caching solution realize the requirements of product ranking list? During the development process, we often need to deal with the requirements of rankings, such as displaying a...
