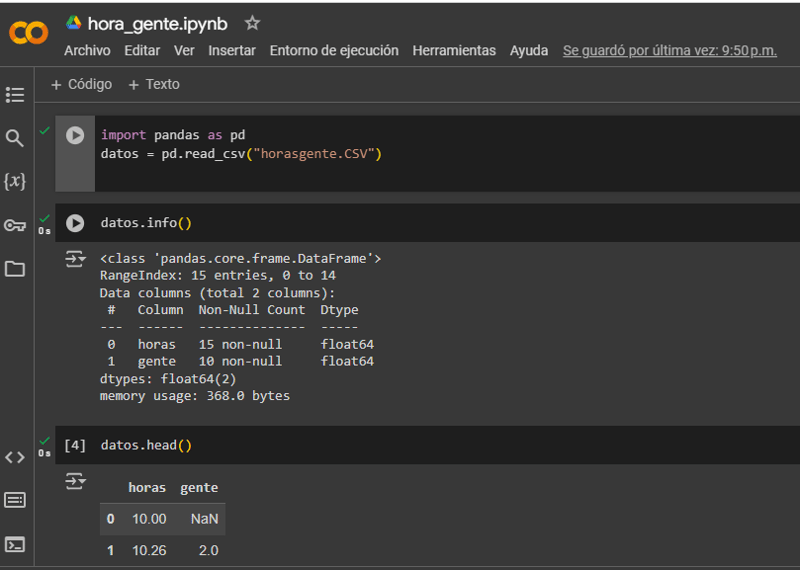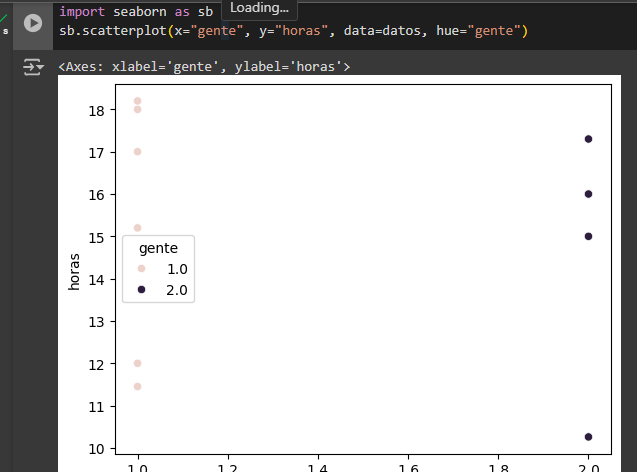
Hello to everyone in the DEV community. As you might imagine, customer service can be a bit dull at times, and I try to shake off those dull moments with some fun, exercise, and (yes, it's a bit unusual) a bit of work. Well, combining these three elements with what I'm gradually learning in Python, I had the idea of plotting the number of people entering the optician's shop where I work (yes, I'm an optical technician and contact lens specialist) by the hour. So, a small first step using a CSV file was to graph it with Seaborn. I wanted to share it with all of you in the community. Wishing you all peace, love, and wisdom. A huge greeting from Argentina! :)
this was maded in Google Colab because mi bosses cant install the VSC.


I think that perhaps graphical functions like these may be quite simple, but at the same time, they provide great help to those around us at the end of the day.
The above is the detailed content of Making something new in the work. For more information, please follow other related articles on the PHP Chinese website!


